. 2023 Sep;33(9):1527-1540.
doi: 10.1101/gr.276840.122. Epub 2023 Aug 17.

Elasmobranch genome sequencing reveals evolutionary trends of vertebrate karyotype organization

Affiliations

Elasmobranch genome sequencing reveals evolutionary trends of vertebrate karyotype organization

Kazuaki Yamaguchi et al. Genome Res. 2023 Sep.

Abstract

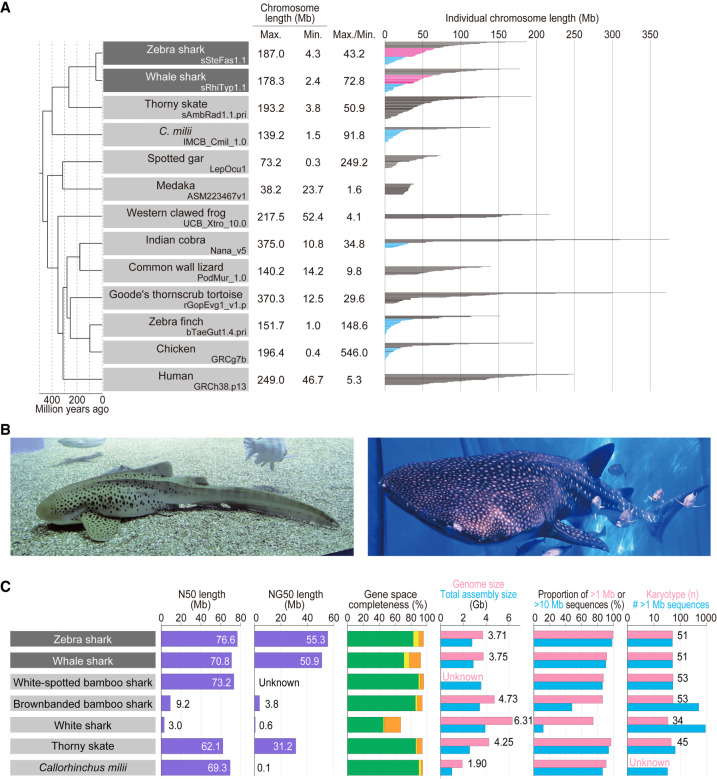
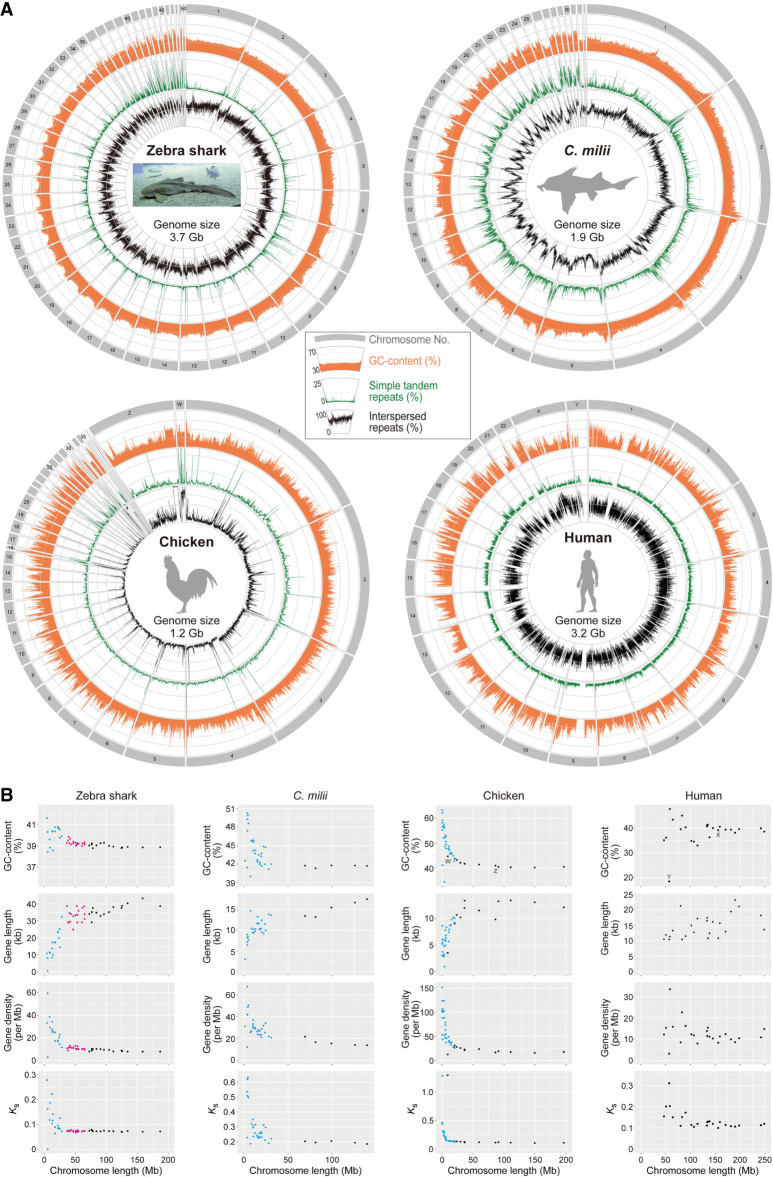
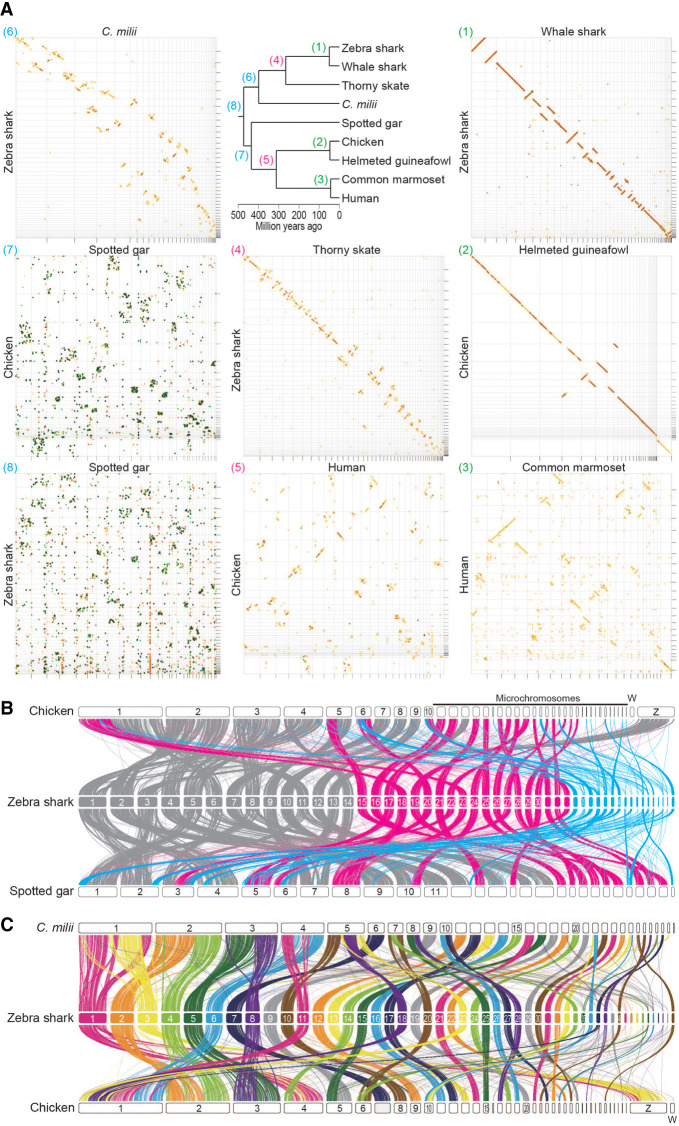
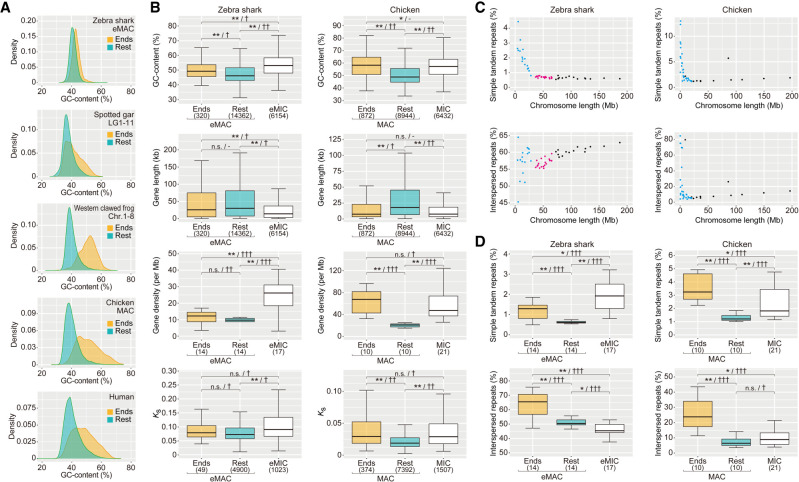
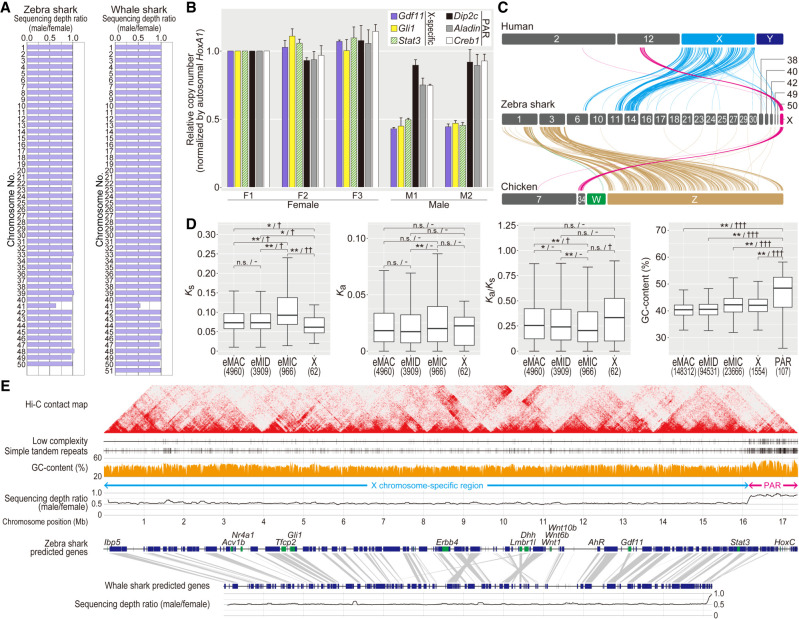
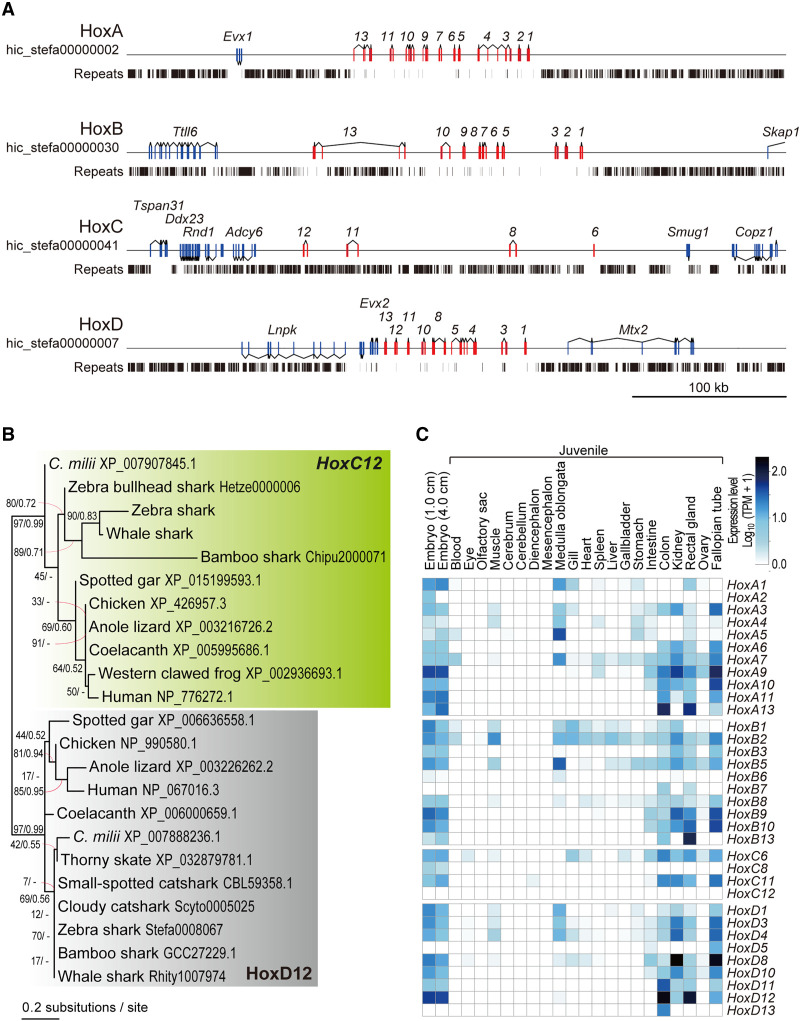
Genomic studies of vertebrate chromosome evolution have long been hindered by the scarcity of chromosome-scale DNA sequences of some key taxa. One of those limiting taxa has been the elasmobranchs (sharks and rays), which harbor species often with numerous chromosomes and enlarged genomes. Here, we report the chromosome-scale genome assembly for the zebra shark Stegostoma tigrinum, an endangered species that has a relatively small genome among sharks (3.71 Gb), as well as for the whale shark Rhincodon typus Our analysis using a male-female comparison identified an X Chromosome, the first genomically characterized shark sex chromosome. The X Chromosome harbors the Hox C cluster whose intact linkage has not been shown for an elasmobranch fish. The sequenced shark genomes show a gradualism of chromosome length with remarkable length-dependent characteristics-shorter chromosomes tend to have higher GC content, gene density, synonymous substitution rate, and simple tandem repeat content as well as smaller gene length and lower interspersed repeat content. We challenge the traditional binary classification of karyotypes as with and without so-called microchromosomes. Even without microchromosomes, the length-dependent characteristics persist widely in nonmammalian vertebrates. Our investigation of elasmobranch karyotypes underpins their unique characteristics and provides clues for understanding how vertebrate karyotypes accommodate intragenomic heterogeneity to realize a complex readout. It also paves the way to dissecting more genomes with variable sizes to be sequenced at high quality.


Figures

Figure 1.
Figure 1.
Shark species studied and comparative statistics of their genome assemblies. (A) The karyotypes of diverse vertebrate species are depicted with the length of individual chromosomal DNA sequences. The maximum and minimum chromosome lengths are based on the records in NCBI Genomes. Microchromosomes for osteichthyans are shown in light blue according to individual original reports (International Chicken Genome Sequencing Consortium 2004; Knief and Forstmeier 2016; Suryamohan et al. 2020; Nakatani et al. 2021), whereas the eMID and eMIC of the two shark species whose genomes have been sequenced in the present study (see Results) are shown in magenta and light blue, respectively. (B) Zebra shark (left) and whale shark (right). Photo credit: Shigehiro Kuraku (left), Rui Matsumoto (right). (C) Statistics of the genome assemblies. The identifiers of the genome assemblies, as well as statistical comparison of more metrics, are included in Supplemental Table 1. Gene space completeness shows the proportions of selected one-to-one protein-coding orthologs with “complete” (green), “duplicated” (yellow), and “fragmented” (orange) coverages retrieved in the sequences by the BUSCO pipeline (see Methods). The details of the genome sizes and karyotypes included are based on existing literature (Schwartz and Maddock 1986, 2002; Hardie and Hebert 2004; Uno et al. 2020).
Figure 2.
Figure 2.
Chromosomal sequence compositions of the zebra shark and selected vertebrate species. (A) Sequence characterization of different chromosomal segments. The orange areas show GC content (30%–70%), whereas the green and black lines show content of simple tandem repeats (0%–25%) and interspersed repeats (0%–100%), respectively, in 100-kb-long nonoverlapping windows. (B) Two-dimensional plots of GC content and median values of gene length, gene density, and the median of synonymous substitutions per synonymous site (Ks) for protein-coding genes on individual chromosomes. See Methods for statistical tests for correlation of these features with chromosome length. Computation of Ks was performed for each of the four species in order by involving a pair species, namely, whale shark Rhincodon typus; small-eyed rabbitfish Hydrolagus affinis; helmeted guineafowl Numida meleagris; and common marmoset Callithrix jacchus. Zebra shark chromosomes are shown as three groups, eMAC, eMID, and eMIC (see text for details), in black, magenta, and cyan, respectively, whereas microchromosomes of the chicken and Callorhinchus milii are colored in cyan. At the moment, C. milii is the only holocephalan species with a chromosome-scale genome assembly.
Figure 3.
Figure 3.
Cross-species investigation of chromosomal homology. (A) Dot matrices showing genome sequence similarities for selected pairs of vertebrate species with variable divergence times. Sequences of high similarity are shown with diagonal lines by the program D-GENIES (Cabanettes and Klopp 2018) with the “Many repeats” mode. The numbers given to the individual panels (1) to (8), correspond to those at the nodes in the phylogenetic tree and are colored differentially to indicate comparable divergence times. Diagonal lines are colored according to the level of sequence divergence (dark green, 75%–100%; light green, 50%–75%; orange, 25%–50%; yellow, 0%–25%). (B) Chromosomal homology suggested by synteny conservation of one-to-one ortholog pairs. See Methods for details. The color of the ribbons connecting the synteny represents each of the three categories of the zebra shark chromosomes: eMAC (gray); eMID (magenta); and eMIC (cyan). (C) Chromosomal homology between the zebra shark and other vertebrates. Conserved synteny is visualized with the inter-specific correspondence of one-to-one orthologs (see Methods).
Figure 4.
Figure 4.
Intrachromosomal heterogeneity of sequence characteristics. (A) Comparison of global GC content in 10-kb-long nonoverlapping windows between the 1-Mb-long ends and the remainders of relatively large chromosomes for diverse vertebrates. (B) Comparison of GC content of protein-coding regions, gene length, gene density, and synonymous substitution rate (Ks) among the 1-Mb-long chromosome ends, their remainders, and relatively small chromosomes (zebra shark eMIC and chicken microchromosomes [MIC]), for the zebra shark and chicken, respectively. (C) Two-dimensional plots of chromosome lengths and the coverage of interspersed repeats and simple tandem repeats. The coloring of the dots follows that in Figure 2B. (D) Differential distribution of simple tandem repeats and interspersed repeats. Proportions of the sequences identified as simple tandem repeats and interspersed repeats in 10-kb-long windows were compared between the 1-Mb-long ends of relatively large chromosomes (zebra shark eMAC and chicken macrochromosomes [MAC]), their remainders, and relatively small chromosomes (zebra shark eMIC and chicken MIC). In B and D, significance of difference is indicated as follows: (*) P-value < 0.05/number of tests, (**) P-value < 0.01/number of tests; (n.s.) not significant. The effect sizes in statistical tests are indicated with a hyphen for no effect, one dagger symbol “†” for small effect, two dagger symbols “††” for medium effect, and three dagger symbols “†††” for large effect. Numbers of the genomic regions sampled are included in parentheses. See Methods for more details about statistical tests.
Figure 5.
Figure 5.
Genomic identification of the zebra shark Chromosome X. (A) Male–female ratio of short-read sequencing depth in the shark chromosomes. (B) Male-female copy-number difference of zebra shark Chromosome X. Amplification levels of the genes on the PAR and the remainders of Chromosome X (scaffold 41) was quantified using real-time PCR controlled with amplification of autosomal genomic regions, by normalizing the PCR product abundance with that for the individual F1 (sSteFas1) (see Methods). (C) Cross-species synteny of sex chromosome-linked genes based on 1-to-1 orthologs. (D) Characteristic comparisons between the different chromosome categories in the zebra shark. Ks (synonymous substitution rate) and Ka (nonsynonymous substitution rate) values were calculated for 1-to-1 orthologs shared with the whale shark. Only for GC content, the PAR was shown separately, because it contained few genes. Significance of difference is indicated as follows: (*) P-value < 0.05/number of tests, (**) P-value < 0.01/number of tests; (n.s.) not significant. The effect sizes are indicated with a hyphen for no effect, one dagger symbol “†” for small effect, two dagger symbols “††” for medium effect, and three dagger symbols “†††” for large effect in statistical tests. Numbers of the genomic regions sampled are shown in parentheses. See Methods for more details about statistical tests. (E) Structural comparison between the zebra shark and whale shark X Chromosome sequences. We focused more on the zebra shark because we could not retrieve a part of the whale shark chromosome that is homologous to the putative zebra shark Chromosome X.
Figure 6.
Figure 6.
Zebra shark Hox C genes. (A) Genomic structure of the zebra shark Hox clusters and their neighboring regions. The exons of the Hox genes are shown in red boxes. (B) Molecular phylogenetic tree of Hox12 group of genes. The tree was inferred with the maximum-likelihood method as described in Methods. (C) Expression profiles of the zebra shark Hox genes in embryos and various tissues of a juvenile.

Similar articles

Cited by

References

    1. Bertho S, Herpin A, Schartl M, Guiguen Y. 2021. Lessons from an unusual vertebrate sex-determining gene. Philos Trans R Soc Lond B Biol Sci 376: 20200092. 10.1098/rstb.2020.0092 - DOI - PMC - PubMed
    1. Braasch I, Gehrke AR, Smith JJ, Kawasaki K, Manousaki T, Pasquier J, Amores A, Desvignes T, Batzel P, Catchen J, et al. 2016. The spotted gar genome illuminates vertebrate evolution and facilitates human-teleost comparisons. Nat Genet 48: 427–437. 10.1038/ng.3526 - DOI - PMC - PubMed
    1. Brůna T, Hoff KJ, Lomsadze A, Stanke M, Borodovsky M. 2021. BRAKER2: automatic eukaryotic genome annotation with GeneMark-EP+ and AUGUSTUS supported by a protein database. NAR Genom Bioinform 3: lqaa108. 10.1093/nargab/lqaa108 - DOI - PMC - PubMed
    1. Burt DW. 2002. Origin and evolution of avian microchromosomes. Cytogenet Genome Res 96: 97–112. 10.1159/000063018 - DOI - PubMed
    1. Cabanettes F, Klopp C. 2018. D-GENIES: dot plot large genomes in an interactive, efficient and simple way. PeerJ 6: e4958. 10.7717/peerj.4958 - DOI - PMC - PubMed

Publication types

LinkOut - more resources