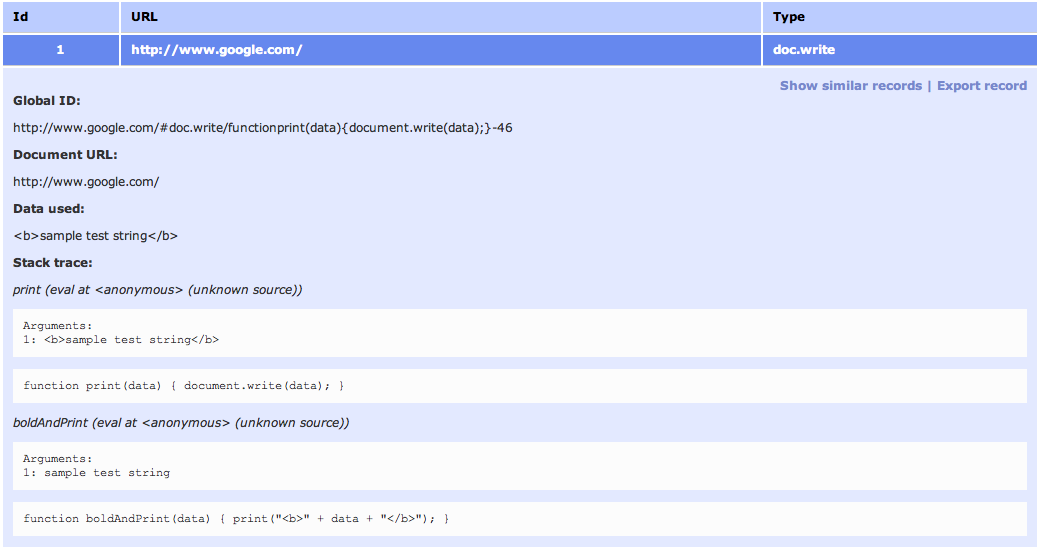
Short report in Chrome extension’s popup, detailing both overall scores and per-script coverage.
Main features:
Report current and previous total Javascript coverage percentages and total number of instrumented code instructions.
Report Javascript coverage per individual instruction for each internal and external script.
Display detailed reports with annotated Javascript source code.
Recalculate coverage statistics while loading the page and on user actions.
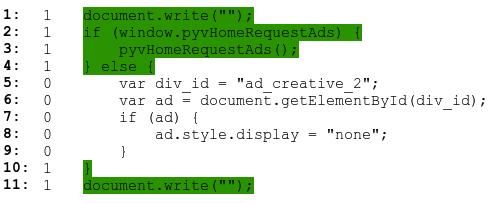
Sample of annotated source code from detailed report. First two columns are line number and number of times each instruction has been executed.
Here are the benefits of ScriptCover over other existing tools:
Per instructions coverage for external and internal scripts: The tool formats original external and internal Javascript code from ‘<script>’ tags to ideally place one instruction per line and then calculates and displays Javascript coverage statistics. It is useful even when the code is compressed to one line.
Dynamic: Users can get updated Javascript coverage statistics while the web page is loading and while interacting with the page.
Easy to use: Users with different levels of expertise can install and use the tool to analyse coverage. Additionally, there is no need to write tests, modify the web application’s code, save the inspected web page locally, manually change proxy settings, etc. When the extension is activated in a Chrome browser, users just navigate through web pages and get coverage statistics on the fly.
It’s free and open source!
Want to try it out? Install ScriptCover and let us know what you think.
Test Analytics has two main parts: first and foremost, it's a step-by-step tool to create an ACC matrix that's faster and much simpler than the Google Spreadsheets we used before the tool existed. It also provides visualizations of the matrix and risks associated with your ACC Capabilities that were difficult or impossible to do in a simple spreadsheet.
A project’s Capabilities grid.
The second part is taking the ACC plan and making it a living, automatic-updating risk matrix. Test Analytics does this by importing quality signals from your project: Bugs, Test Cases, Test Results, and Code Changes. By importing these data, Test Analytics lets you visualize risk that isn't just estimated or guessed, but based on quantitative values. If a Component or Capability in your project has had a lot of code change or many bugs are still open or not verified as working, the risk in that area is higher. Test Results can provide a mitigation to those risks -- if you run tests and import passing results, the risk in an area gets lower as you test.
A project’s risk, calculated as a factor of inherent risk as well as imported quality signals.
This part's still experimental; we're playing around with how we calculate risk based on these signals to best determine risk. However, we wanted to release this functionality early so we can get feedback from the testing community on how well it works for teams so we can iterate and make the tool even more useful. It'd also be great to import even more quality signals: code complexity, static code analysis, code coverage, external user feedback and more are all ideas we've had that could add an even higher level of dynamic data to your test plan.
An overview of test results, bugs, and code changes attributed to a project’s capability. The Capability’s total risk is affected by these factors.
You can check out a live hosted version, browse or check out the code along with documentation, and of course if you have any feedback let us know - there's a Google Group set up for discussion, where we'll be active in responding to questions and sharing our experiences with Test Analytics so far.
Google JS Test is a JavaScript unit testing framework that runs on the V8 JavaScript Engine, the same open source project that is responsible for Google Chrome’s super-fast JS execution speed. Google JS Test is used internally by several Google projects, and we’re pleased to announce that it has been released as an open source project.
Features of Google JS Test include:
Extremely fast startup and execution time, without needing to run a browser.
Clean, readable output in the case of both passing and failing tests.
An optional browser-based test runner that can simply be refreshed whenever JS is changed.
Style and semantics that resemble Google Test for C++.
A built-in mocking framework that requires minimal boilerplate code (e.g. no $tearDown or$verifyAll calls), with style and semantics based on the Google C++ Mocking Framework.
A system of matchers allowing for expressive tests and easy to read failure output, with many built-in matchers and the ability for the user to add their own.
See the Google JS Test project home page for a quick introduction, and the getting started page for a tutorial that will teach you the basics in just a few minutes.
When filing a bug, BITE automatically grabs screenshots, links, and problematic UI elements and attaches them to the bug. This gives developers charged with investigating and/or fixing the bug a wealth of information to help them determine root causes and factors in the behavior.
When it comes to reproducing a bug, testers will often labor to remember and accurately record the exact steps taken. With BITE, however, every action the tester takes on the page is recorded in JavaScript, and can be played back later. This enables engineers to quickly determine if the steps of a bug repro in a specific environment, or whether a code change has resolved the issue.
Also included in BITE is a Record/Playback console to automate user actions in a manual test. Like the BITE recording experience, the RPF console will automatically author javascript that can be used to replay your actions at a later date. And BITE’s record and playback mechanism is fault tolerant; UI automation tests will fail from time to time, and when they do, it tends to be for test issues, rather than product issues. To that end, when a BITE playback fails, the tester can fix their recording in real-time, just by repeating the action on the page. There’s no need to touch code, or report a failing test; if your script can’t find a button to click on, just click on it again, and the script will be fixed! For those times when you do have to touch the code, we’ve used the Ace (http://ace.ajax.org/) as an inline editor, so you can make changes to your javascript in real-time.
Check out the BITE project page at http://code.google.com/p/bite-project. Feedback is welcome at [email protected]. Posted by Joe Allan Muharsky from the Web Testing Technologies Team (Jason Stredwick, Julie Ralph, Po Hu and Richard Bustamante are the members of the team that delivered the product).
Posted by Ibrahim El Far, Web Testing Technologies Team (Eriel Thomas, Jason Stredwick, Richard Bustamante, and Tejas Shah are the members of the team that delivered this product)
This works great while the codebase is small, code flux is reasonable and tests are fast. As a codebase grows over time, the effectiveness of such a system decreases. As more code is added, each clean run takes much longer and more changes gets crammed into a single run. If something breaks, finding and backing out the bad change is a tedious and error prone task for development teams.
Software development at Google is big and fast. The code base receives 20+ code changes per minute and 50% of the files change every month! Each product is developed and released from ‘head’ relying on automated tests verifying the product behavior. Release frequency varies from multiple times per day to once every few weeks, depending on the product team.
With such a huge, fast-moving codebase, it is possible for teams to get stuck spending a lot of time just keeping their build ‘green’. A continuous integration system should help by providing the exact change at which a test started failing, instead of a range of suspect changes or doing a lengthy binary-search for the offending change. To find the exact change that broke a test, we could run every test at every change, but that would be very expensive.
To solve this problem, we built a continuous integration system that uses dependency analysis to determine all the tests a change transitively affects and then runs only those tests for every change. The system is built on top of Google’s cloud computing infrastructure enabling many builds to be executed concurrently, allowing the system to run affected tests as soon as a change is submitted.
Here is an example where our system can provide faster and more precise feedback than a traditional continuous build. In this scenario, there are two tests and three changes that affect these tests. The gmail_server_tests are broken by the second change, however a typical continuous integration system will only be able to tell that either change #2 or change #3 caused this test to fail. By using concurrent builds, we can launch tests without waiting for the current build/test cycle to finish. Dependency analysis limits the number of tests executed for each change, so that in this example, the total number of test executions is the same as before.
Let’s look deeper into how we perform the dependency analysis.
We maintain an in-memory graph of coarse-grained dependencies between various tests and build rules across the entire codebase. This graph, several GBs in-memory, is kept up-to-date with each change that gets checked in. This allows us to transitively determine all tests that depend on the code modified in a given change and hence need to be re-run to know the current state of the build. Let’s walk through an example.
Consider two sample projects, each containing a different set of tests:
where the build dependency graph looks like this:
We will see how two isolated code changes, at different depths of the dependency tree, are analyzed to determine affected tests, that is the minimal set of tests that needs to be run to ensure that both Gmail and Buzz projects are “green”.
Case1: Change in common library
For first scenario, consider a change that modifies files in common_collections_util.
As soon as this change is submitted, we start a breadth-first search to find all tests that depend on it.
Once all the direct dependencies are found, continue BFS to collect all transitive dependencies till we reach all the leaf nodes.
When done, we have all the tests that need to be run, and can calculate the projects that will need to update their overall status based on results from these tests.
Case2: Change in a dependent project:
When a change modifying files in youtube_client is submitted.
We perform the same analysis to conclude that only buzz_client_tests is affected and status of Buzz project needs to be updated:
The example above illustrates how we optimize the number of tests run per change without sacrificing the accuracy of end results for a project. A lesser number of tests run per change allows us to run all affected tests for every change that gets checked in, making it easier for a developer to detect and deal with an offending change.
Use of smart tools and cloud computing infrastructure in the continuous integration system makes it fast and reliable. While we are constantly working on making improvements to this system, thousands of Google projects are already using it to launch-and-iterate quickly and hence making faster user-visible progress.