How to reduce TTFB

ON THIS PAGE
- Measuring TTFB
- What is Tracing?
- Setting up Tracing in Next.js with Sentry
- Custom Instrumentation
- Start Reducing TTFB with Sentry
TTFB (Time to First Byte) is a commonly used metric that measures the duration between a client's HTTP request and the receipt of the first byte of the server's response. A lower TTFB means a more responsive server and faster page load times. In the past few years in the web dev world, we’ve seen a significant push towards rendering our websites on the server. Doing so is better for SEO and performs better on low-powered devices, but one thing we had to sacrifice is TTFB. Because our pages are rendered on the server at request time (instead of pre-rendered statically at build time), our browsers have to wait longer for the servers to respond. That causes the TTFB to be higher, and when the TTFB is higher, the rest of the web vitals are higher as well. In this article, we’ll see how we can identify what makes our TTFB high so we can fix it.
Measuring TTFB
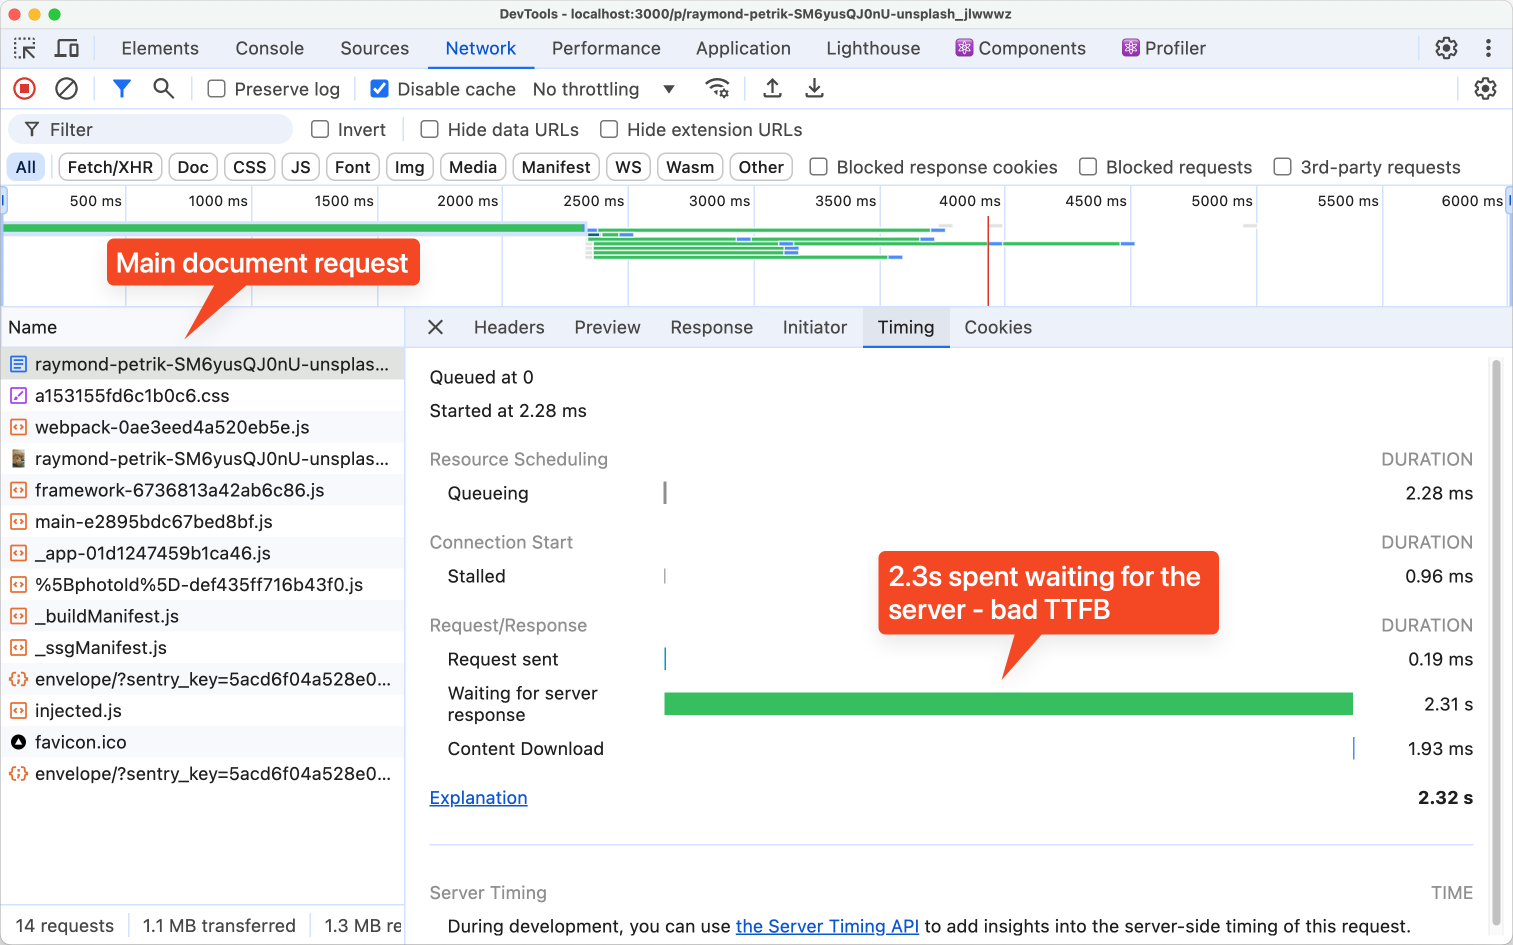
Let’s say you have a server-side rendered Next.js application, and you know that some of your pages load much slower than others. You go to Chrome DevTools to see where the slowdown happens:
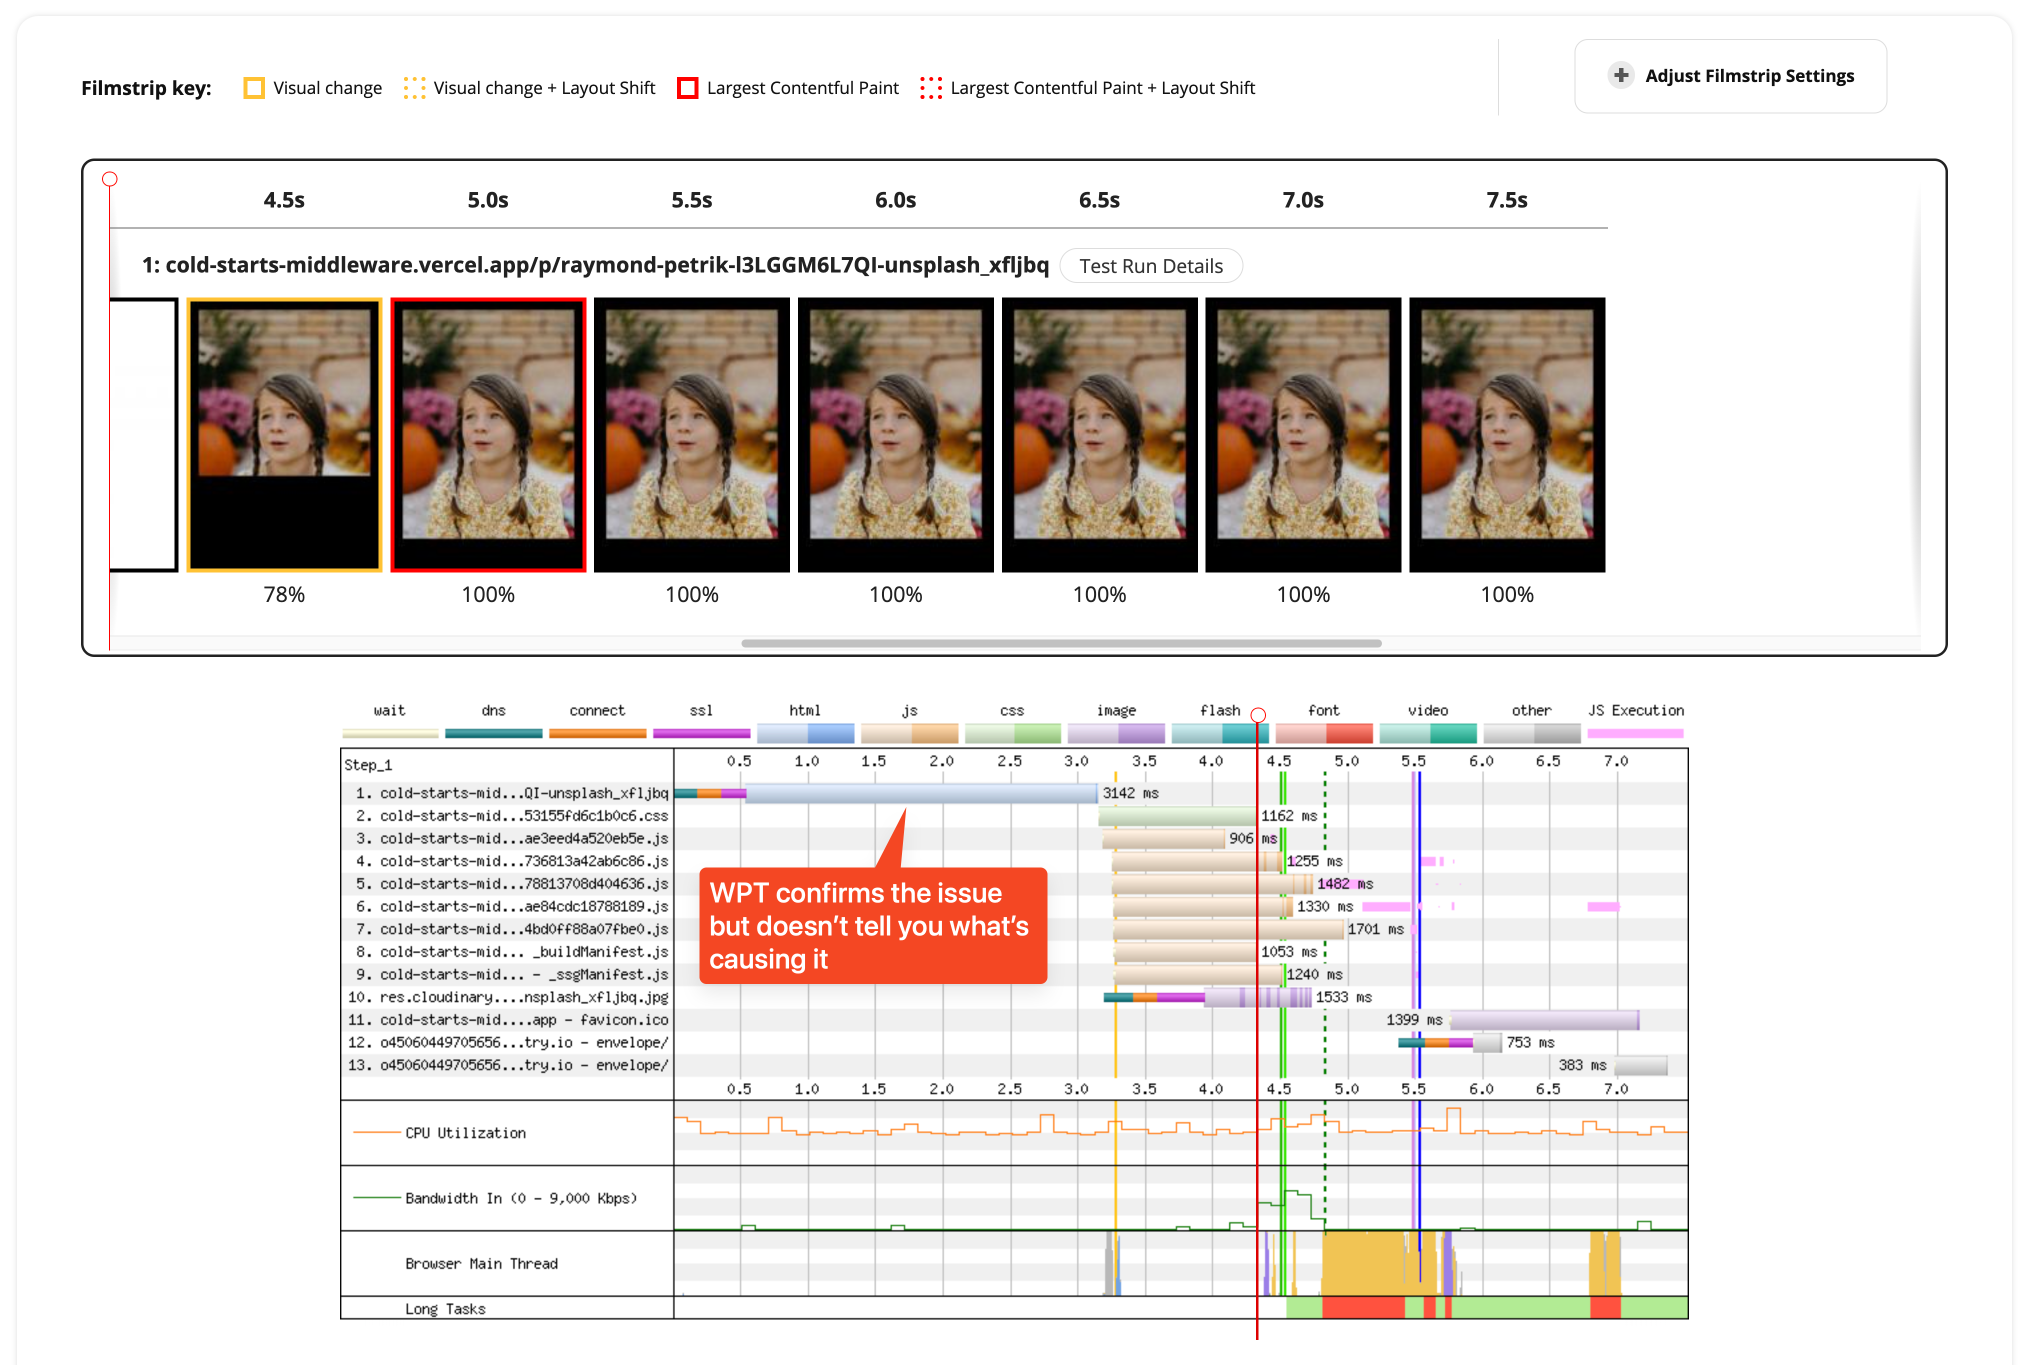
Unfortunately, the only insight you can gather is that the browser spent over two seconds waiting for the server to respond, but DevTools doesn’t show you what exactly in the page load timeline took so long. You might think to run a test on WebPageTest as well:
Again, you see that there’s definitely a problem, but you still don’t know what’s causing it. These tools will only show you what the browser sees and experiences. A slowdown on the server causes a high TTFB, so you need a different kind of tool to see what’s happening on the server when loading the page. You need tracing.
What is Tracing?
Tracing is a tool that is commonly used to help you debug performance issues, but it is also useful for finding weird, complex bugs like race conditions. It works by creating “spans” (smallest unit of work) that are linked to each other, have a start time and end time, and all belong to the same “trace”. We create those spans around functions or code blocks that we want to measure. Depending on the library you’re using, those spans can also be automatically created. We’ll be using Sentry in this article, which integrates directly with Next.js and creates the majority of the spans you’ll need to debug the high TTFB.
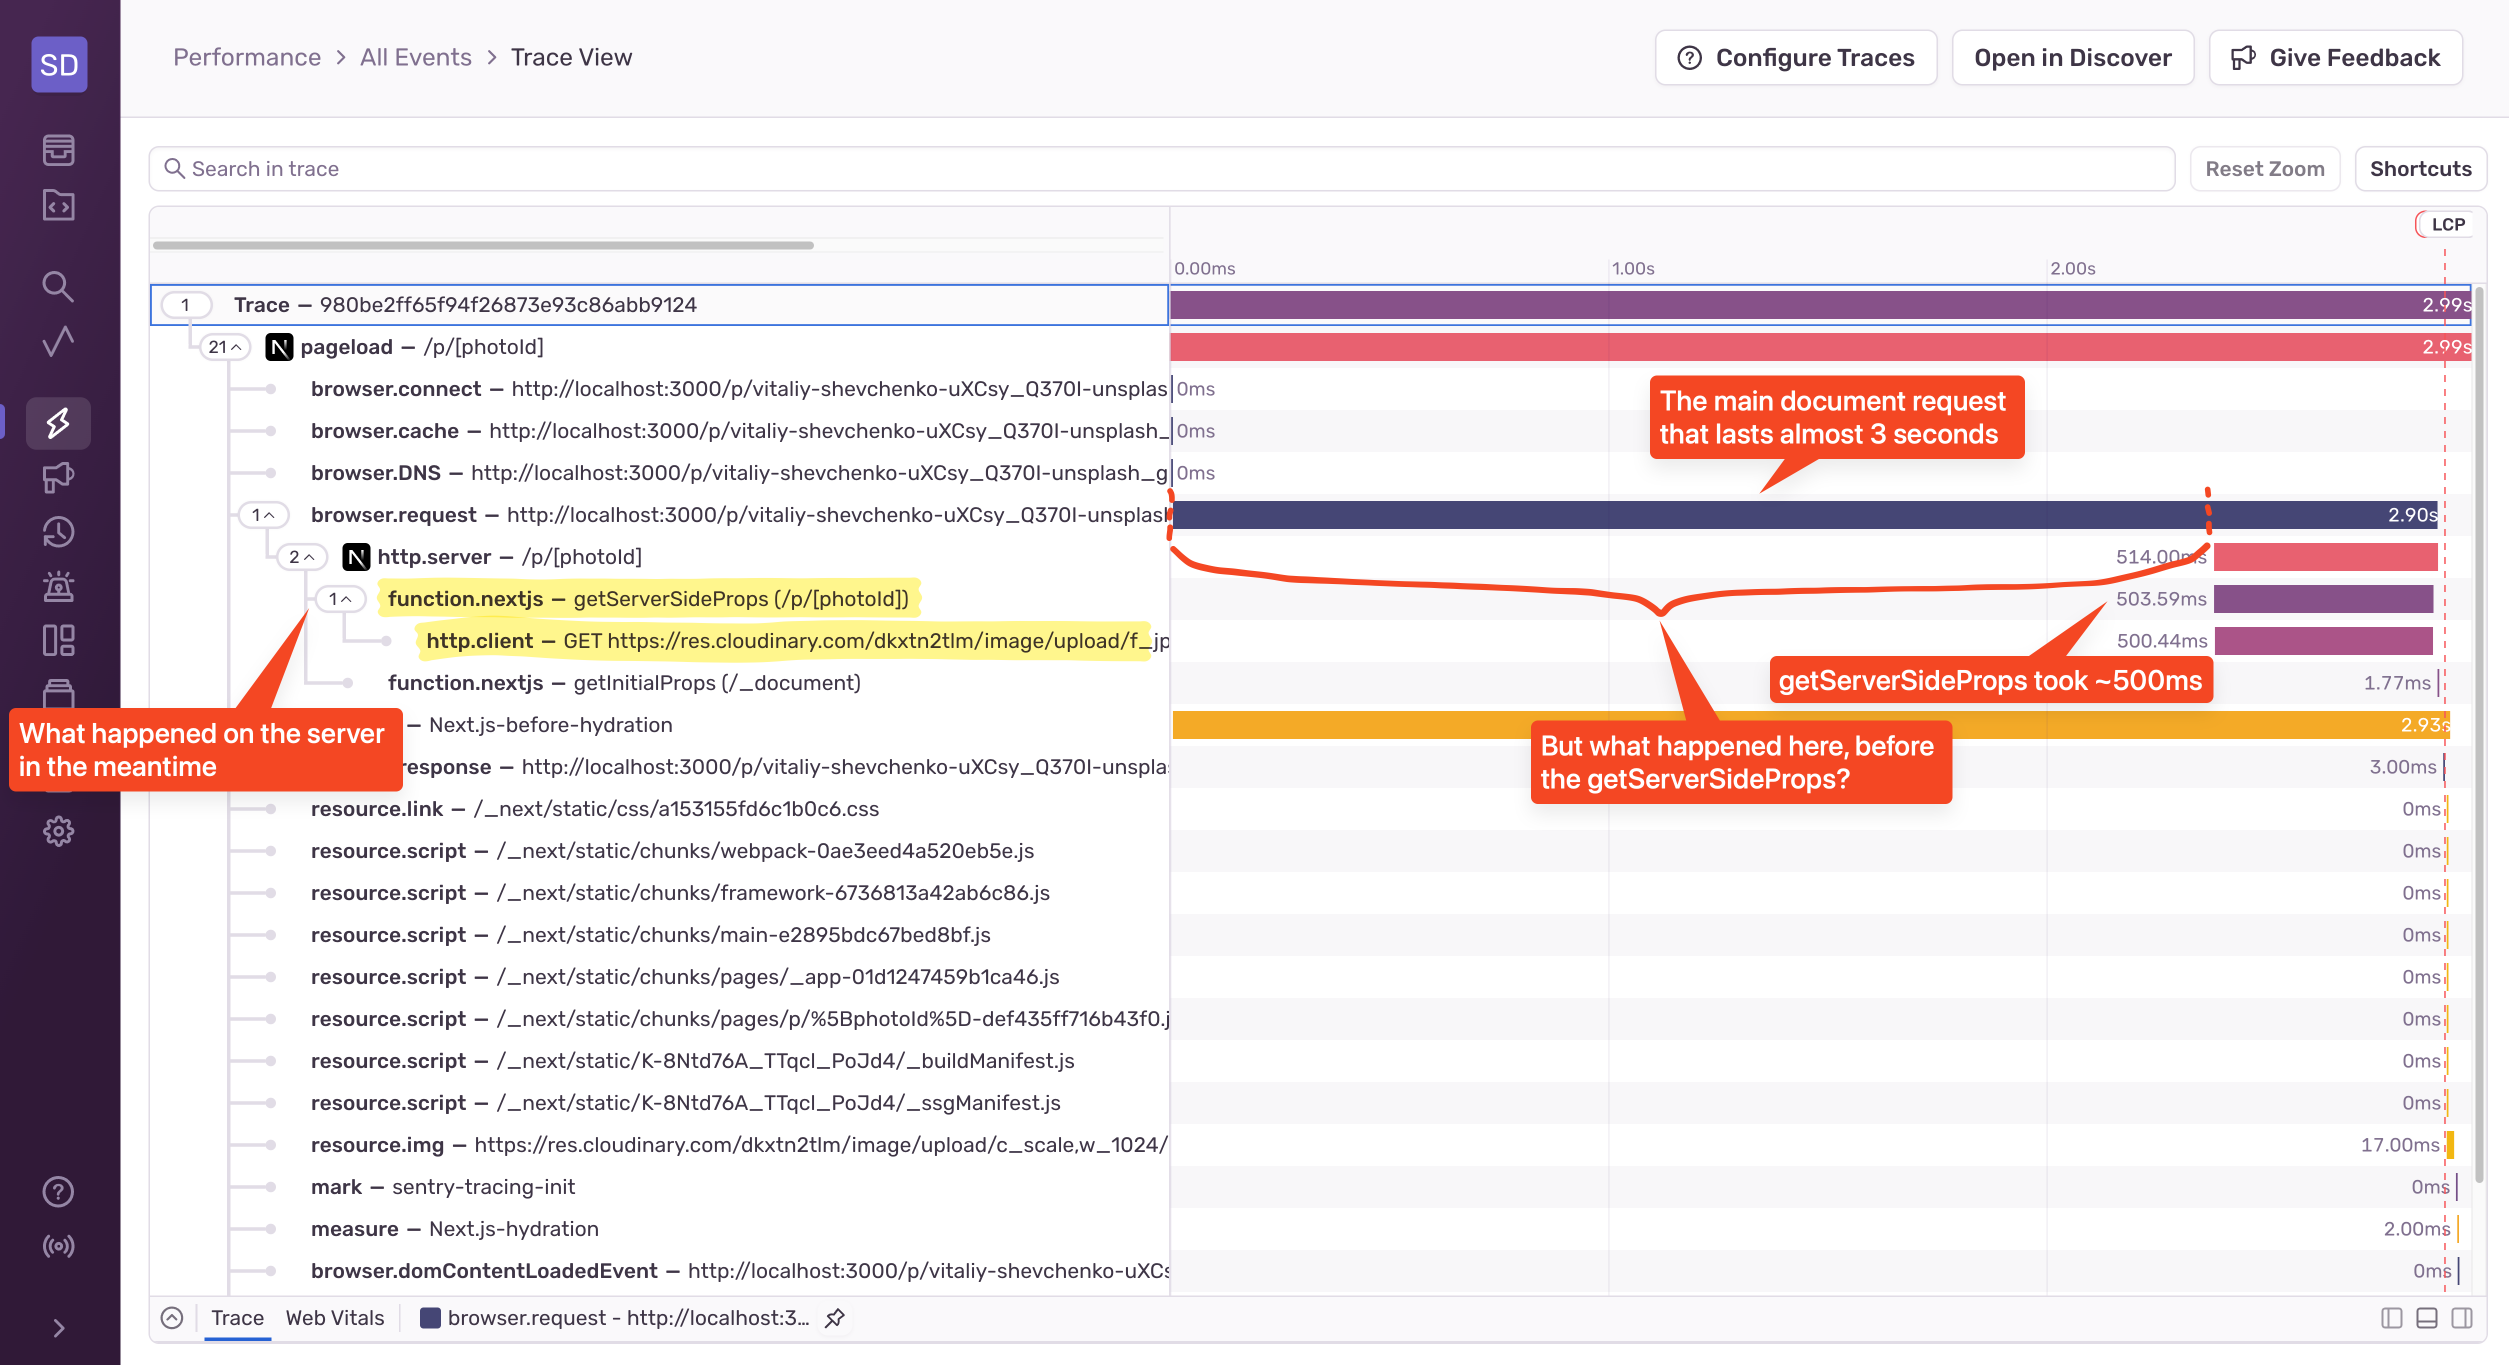
Traces can also be distributed, which means you can start a trace on the client-side, and then seamlessly continue tracing on the server. This creates a single timeline of what happens both on the client and server. Sentry visualizes the trace and all of its spans in a so-called Flame Graph:
If you want to learn more about tracing, check out my other article, “Distributed Tracing: A Powerful Mechanism for Application Debugging and Monitoring”.
Setting up Tracing in Next.js with Sentry
To set up Sentry’s Tracing in Next.js, you just need to install and configure Sentry. Once you go through the instructions and run your application, you’ll start to send performance data to Sentry of your page loads:
From this screenshot, we can see a clear timeline of what happened both in the browser and on the server. We can see that the getServerSideProps function took around 500ms, which was the Cloudinary request. In this case, the request is to make sure that the resource exists before we render the page. Can we optimize that? Sure, we can either cache it or find a different (faster) way to check whether the resource exists or not.
If the getServerSideProps function was the only culprit, we’re done with the optimization! But in this case, it’s not. We can see that the majority of the slowdown happens even before the getServerSideProps function gets executed. And what happens before the getServerSideProps? THE MIDDLEWARE! The Middleware is not automatically instrumented, so we’ll have to write some code now.
Custom Instrumentation
Here’s the middleware function:
export async function middleware(request: NextRequest) { await checkAuth(request); const { pathname } = request.nextUrl; if (pathname.startsWith('/p/')) { const publicId = pathname.split('/').pop(); if (publicId) { await checkImageExists(publicId); } } await checkLocale(request); await updateRequest(request); return NextResponse.next(); }
First, we check for authentication, and then we match if the request is for the photo page. If it is, we invoke a function that checks if the image exists (sound familiar?). Then we check if the locale is correctly set, we supplement the request with additional data and tags, and we invoke the next() method.
In order to add custom instrumentation, all we need to do is wrap it with Sentry’s startSpan method:
import * as Sentry from '@sentry/nextjs';

export async function middleware(request: NextRequest) {
  return await Sentry.startSpan(
    { name: 'middleware', op: 'middleware' },
    async () => {
      // the middleware code
    }
  );
}
Because this happens before the browser initiates a trace, it will be treated as a separate trace so we’ll need to look outside of the main page load trace we saw earlier.
If we were to run this, we’d only get one span, but that won’t help us identify which of these functions take up the most time. To produce more detailed results, we need to get into each of those functions and wrap them with the startSpan method:
import * as Sentry from '@sentry/nextjs';
export const checkAuth = async (request: NextRequest) => {
  await Sentry.startSpan({ name: 'check-auth', op: 'function.nextjs' }, () =>
    // checkAuth function body
  );
};
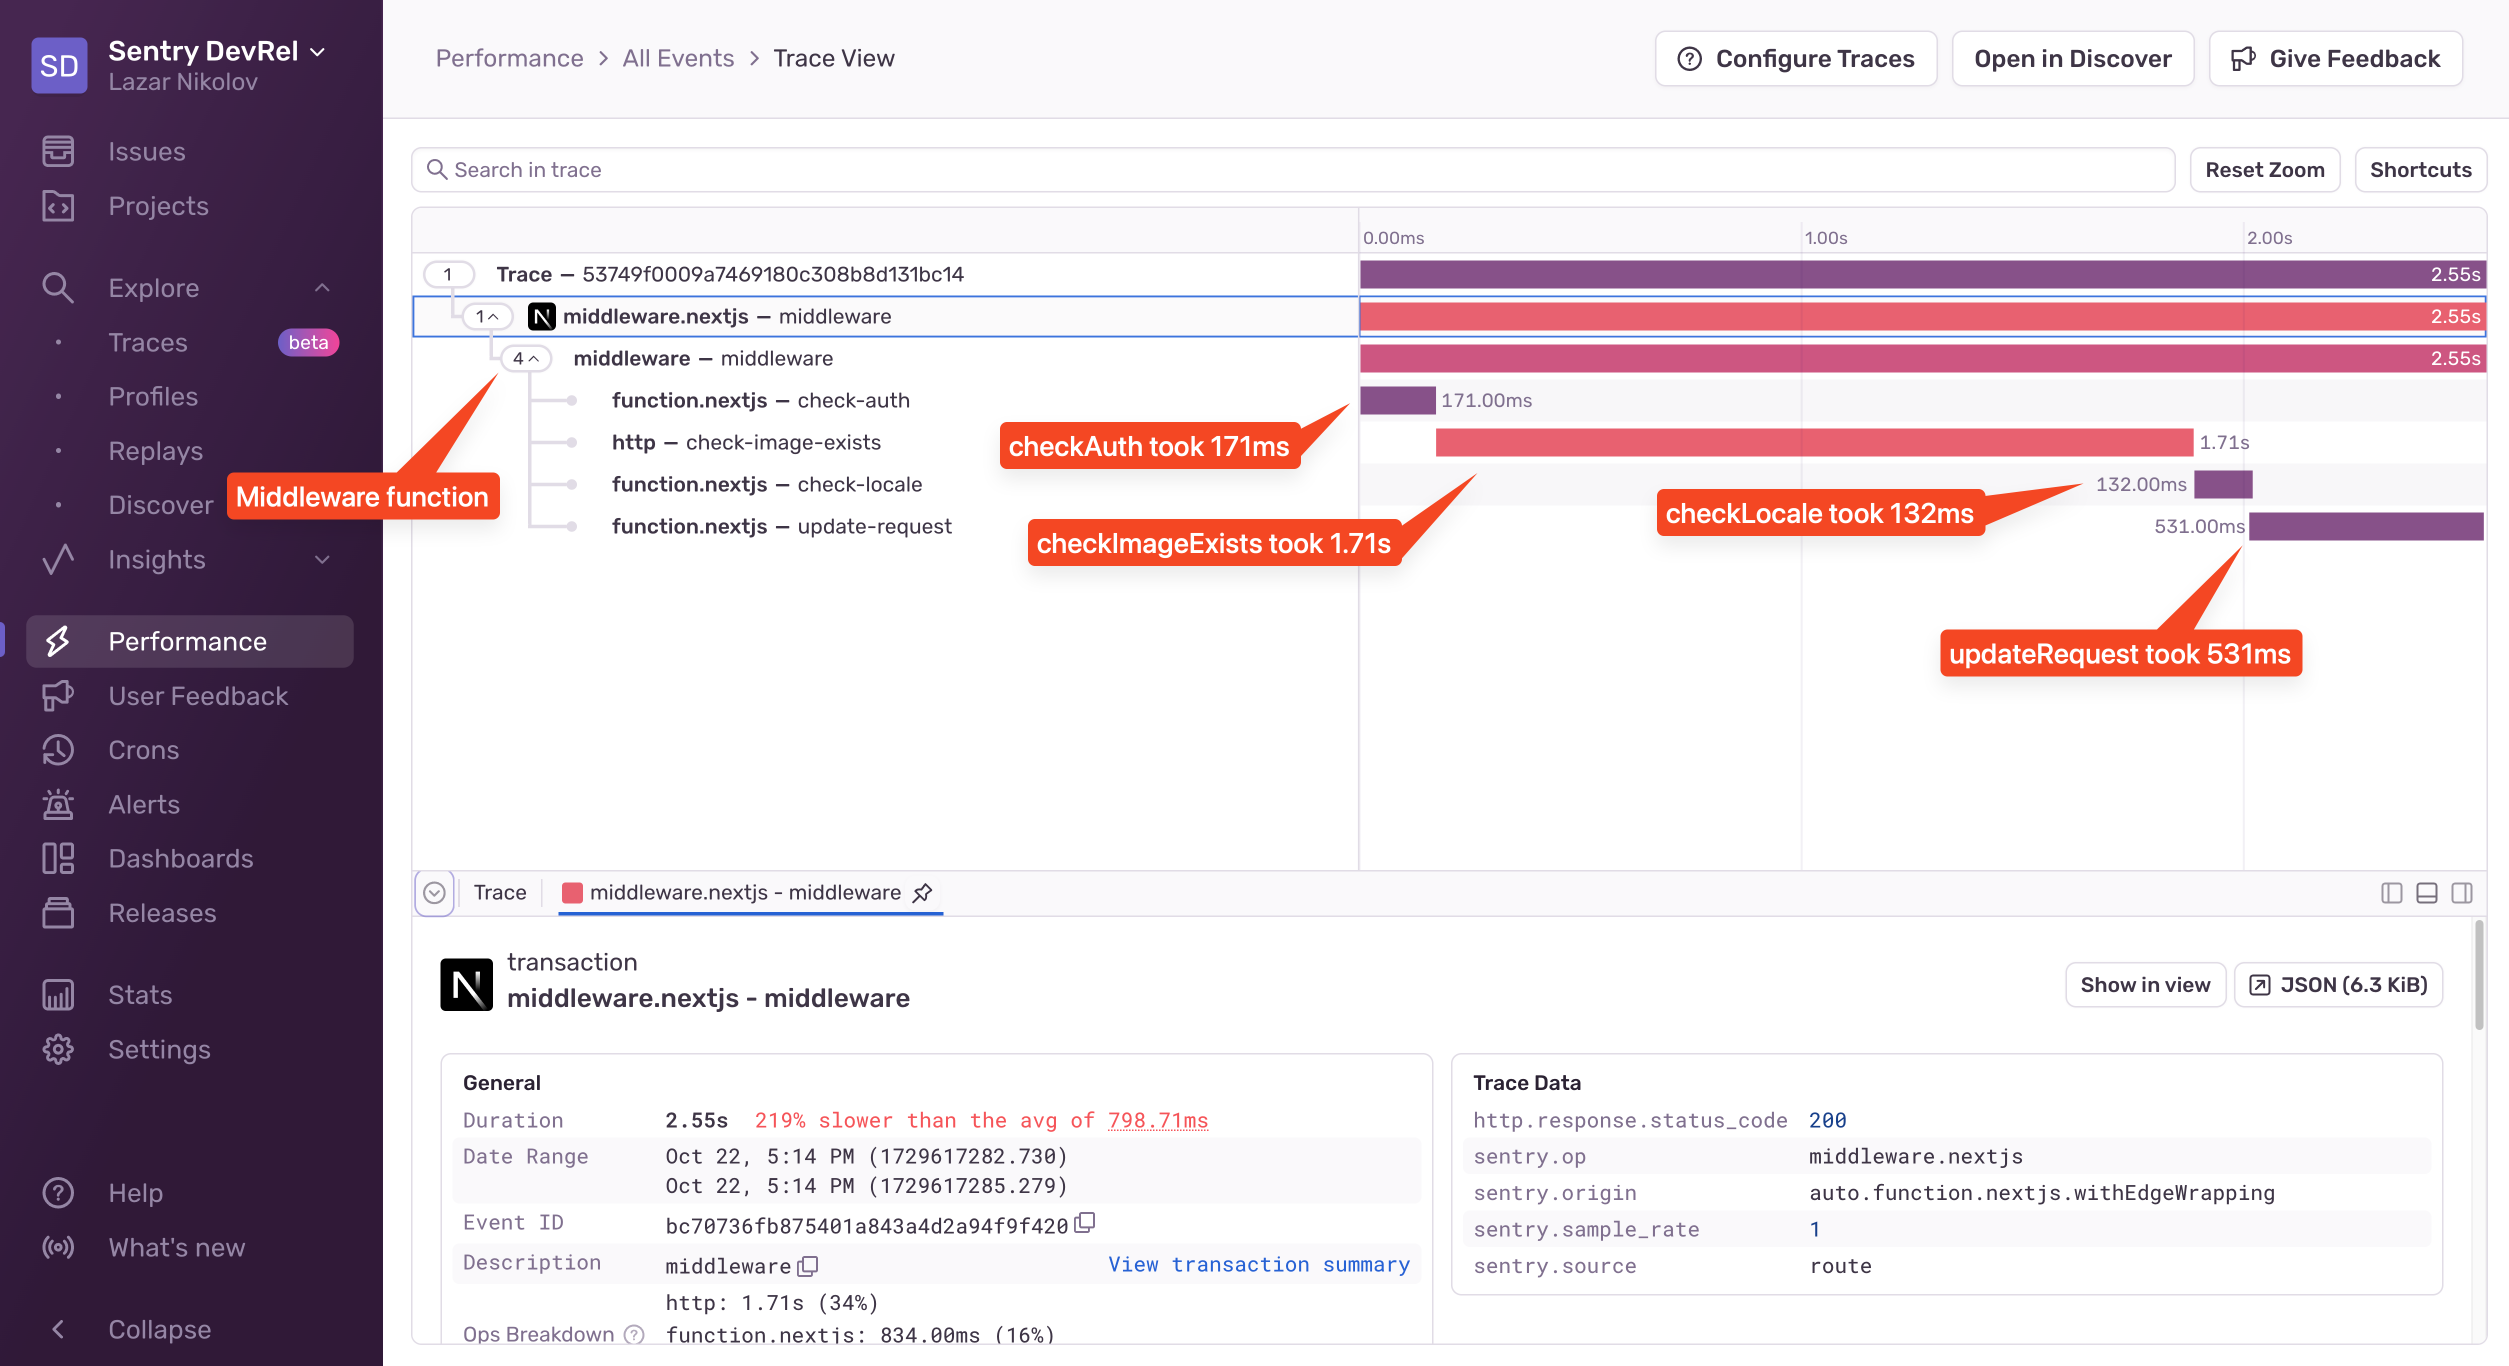
Now if we run the app again and open the new middleware trace, we’ll see this:
We can see that the checkAuth function took 171ms, the checkImageExists took 1.71ms, the checkLocale took 132ms, and the updateRequest took 531ms. This is a great breakdown of the whole middleware function, and we can see exactly how much time each function took.
How do we fix this? Well, there are probably multiple things we can do, like, for example, get rid of the checkImageExists function because we already perform a check in the getServerSideProps function within the page. Removing that will significantly speed up the middleware. Each of the other functions has specific implementations, so we need to look at them individually to figure out how we can optimize them, but that’s not the topic of this article. What’s important is that we have a clear picture of what exactly happens while we’re server-rendering our page - in the middleware, in the page handler on the server, and also in the browser.
Start Reducing TTFB with Sentry
TTFB is easy to measure but hard to reduce. With a lot of websites nowadays being rendered on the server, being able to debug slow TTFB is an important skill to have if you don’t want your website to be slow.
To figure out what causes the TTFB to be high, you need to use a tool other than Chrome DevTools or WebPageTest. Those tools can help you verify that your page is slow due to a high TTFB, but they can’t help you figure out why. You need to implement tracing.
We saw how easy it was to implement tracing with Sentry, and how the trace view showed us what was causing the biggest slowdowns. Sentry’s automatic instrumentation helped us identify optimization opportunities in the getServerSideProps function. We also noticed a long wait time before the actual getServerSideProps function, and that told us that the middleware was causing the biggest slowdown. We added custom instrumentation using Sentry’s startSpan function and saw what function took the longest.
Tracing is a serious tool for debugging complex issues across multiple services, projects, or environments. It tracks the flow of requests through your entire application, from frontend to backend, and with that, it helps you identify performance bottlenecks and failures that traditional logging might miss.
If you want to learn more about tracing, or how tracing solves other types of issues, check out these articles:


