In a recent peer-reviewed paper published in Electronics (MDPI), researchers introduced a visual analytics
framework for exploring complex meteorological datasets that contain spatial, temporal,
and multivariate information. As part of the system’s interactive analysis workflow, the authors used
jQWidgets to support responsive, client-side tabular exploration—especially filtering and sorting of
high-dimensional data.
Source:
https://www.mdpi.com/2079-9292/15/1/168
Project Overview
The research focuses on helping analysts make sense of meteorological data that varies across
geographic locations and time, while also containing many variables
(e.g., temperature, pressure, wind, precipitation). Traditional visualization techniques often struggle to represent
these dimensions simultaneously in a way that stays readable and interactive.
The authors propose a framework centered on Spatiotemporal Parallel Coordinate Plots (STPCPs),
combining multiple coordinated views so users can explore patterns and relationships across time, space, and variables.
The Challenge
Meteorological datasets tend to be large and complex. Analysts need tools that can:
- Represent many variables at once (high dimensionality)
- Preserve spatial context (where measurements happen)
- Preserve temporal context (how values evolve over time)
- Enable interactive exploration without lag
The team’s goal was to build an environment where users can quickly isolate meaningful subsets of data and identify
hidden correlations—without switching between disconnected tools.
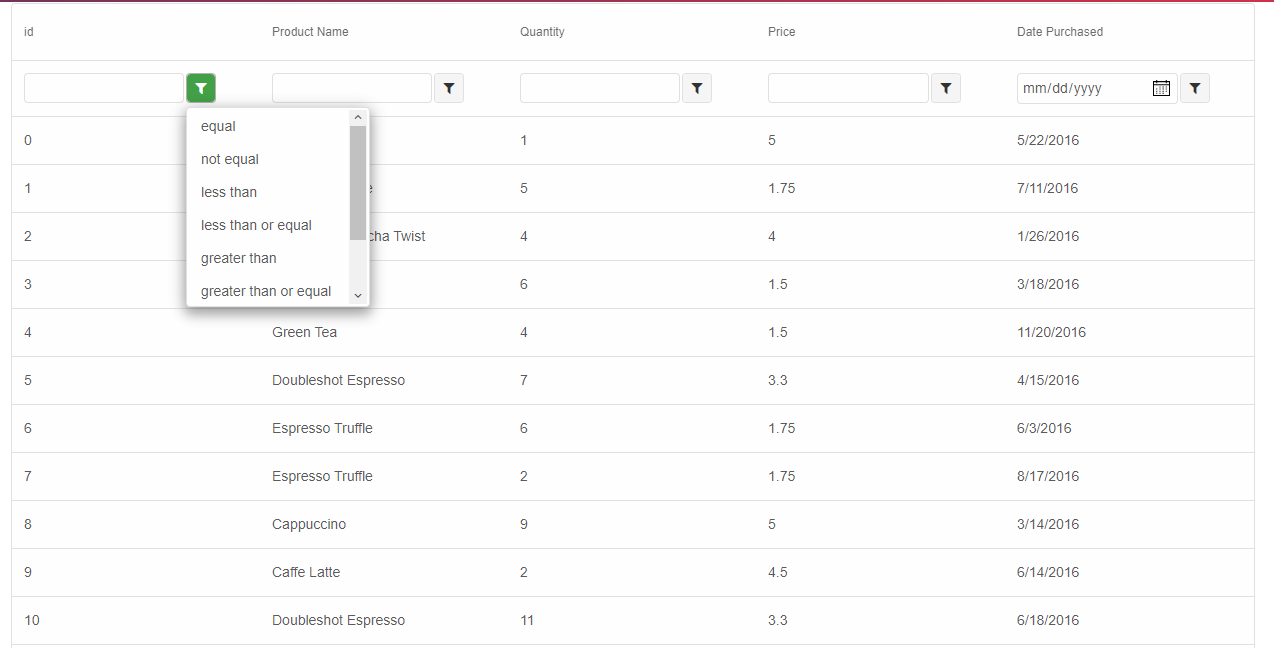
Where jQWidgets Fits in the Solution
Alongside the paper’s core visual views (maps and parallel coordinate plots), the authors integrated an interactive
data table to support exploration and control of the underlying dataset. For this tabular component, they used
jQWidgets (the paper references version 14.0.0).
What jQWidgets Enabled
- Client-side filtering to quickly narrow down large datasets
- Sorting to compare stations, time windows, or variable ranges
- Responsive interaction so the table remains fast and usable during exploration
- Clean integration with a web-based analytics interface
In practice, this means analysts can refine and review the precise records behind a visual pattern—without slow
server round-trips or manual exports.
What the Framework Achieved
The system merges multiple coordinated views into one workflow:
- Geographic map views to provide spatial context
- Parallel coordinate plots to show multivariate relationships
- An interactive data table (powered by jQWidgets) to filter, sort, and inspect data records
Together, these pieces allow users to:
- Explore trends across time and locations
- Identify correlations among meteorological variables
- Drill into subsets of interest through filtering
- Validate visual patterns by inspecting the underlying data
Why jQWidgets Worked Well
| jQWidgets Capability |
Value in the Research System |
| Client-side performance |
Fast, smooth interactions when exploring large, high-dimensional datasets |
| Filtering & sorting UI |
Quickly isolate stations, time periods, and value ranges without writing custom table logic |
| Web integration |
Fits naturally into a browser-based visual analytics environment |
| Stable API & documentation |
Helps teams integrate tabular analysis features efficiently alongside custom visualizations |
Takeaway
This paper is a strong example of how jQWidgets can support not only enterprise dashboards, but also
advanced scientific and academic visualization systems. By providing robust, interactive tabular exploration
(filtering, sorting, and data inspection), jQWidgets helps bridge the gap between complex data and actionable insight.
If you’re building web-based analytics experiences—whether in science, operations, finance, or IoT—this case highlights
a practical approach: combine expressive visualizations with a high-performance UI layer that makes exploration fast,
intuitive, and reliable.
We’re excited to announce the release of jQWidgets v25.0.0, available as of
January 2, 2026. This release focuses on modern framework compatibility,
enterprise-grade security, and usability improvements across the entire component suite.
If you’re building secure, accessible, and future-proof web applications, this release delivers meaningful upgrades.
What’s New
Angular 21 Support
jQWidgets now fully supports Angular 21, ensuring seamless compatibility with the latest Angular features,
build tooling, and performance optimizations.
Angular teams can now:
- Upgrade safely to Angular 21
- Use jQWidgets components without workarounds
- Maintain long-term framework alignment
🔐 Full Content Security Policy (CSP) Compliance Refactor
Enterprise security was a major focus of this release. All core frontend components — including
Scheduler, Grid, Dialogs, Buttons, and Tables — have been refactored to be
fully CSP compliant.
What changed:
- Removed inline styles
- Removed inline event handlers
- Eliminated dynamic script execution
What this means for you: easier compliance with strict CSP headers, a better security posture for enterprise
and government applications, and fewer custom overrides and security exceptions.
What’s Improved
♿ Accessibility Enhancements (WCAG-Aligned)
Accessibility improvements were applied across all components, aligning jQWidgets more closely with
WCAG guidelines.
- Better keyboard navigation
- Improved focus management
- Enhanced screen reader support
- More consistent ARIA attributes
🔍 jqxGrid Filtering Enhancements
A new ComboBox filter has been added to the filter row in jqxGrid.
- Easier filtering for enumerated values
- Improved user experience in data-heavy grids
- Cleaner and more intuitive filtering UI
This is especially useful for dashboards, admin panels, and reporting tools.
🔢 jqxNumberInput UX Improvement
A new option allows you to hide the prompt when the component is not focused, resulting in cleaner layouts,
less visual noise, and improved form usability.
🛠️ What’s Fixed
-
jqxForm — Fixed Smart AI Paste parsing issues in certain form configurations
-
jqxNumberInput — Fixed clipboard handling in simple input mode
-
jqxMaskedInput — Fixed issues with the
val() method and incorrect behavior with ngModel
-
Tailwind theme — Resolved rendering issues affecting multiple components
✅ Why Upgrade to v25.0.0?
With this release, jQWidgets offers enterprise-grade CSP compliance, stronger accessibility out of the box, Angular 21 readiness,
better filtering and form UX, and important stability and theme fixes.
If you’re building modern web applications that demand security, accessibility, and
long-term maintainability, jQWidgets v25.0.0 is a highly recommended upgrade.
Get started today by updating to jQWidgets v25.0.0 and experience the improvements firsthand.
Watch this jqxGrid demo: I directly bound 1,000,000 rows to the grid – no virtual mode, no load-on-demand tricks.
Then I demo lightning-fast scrolling, instant sorting, and super-quick filtering. All buttery smooth in the browser! 🔥
jQWidgets jqxGrid handling massive datasets like a champ.
Posted in:
ANGULAR, ANGULAR GRID, Grid, JavaScript, JavaScript Plugins, JavaScript UI, JavaScript UI Plugins, JavaScript UI Widgets, JavaScript Widgets, jQuery, jQuery Plugins, jQuery UI, jQuery UI Plugins, jQuery UI Widgets, jQuery Widgets, jQWidgets, jqxGrid
Tagged:
#jqxGrid #jQWidgets #JavaScript #DataGrid #WebDev
The jqWidgets team has once again stepped up the game for Angular developers. With the latest release of jqWidgets, full support for Angular 21 has been introduced — opening the door for developers to take advantage of the newest features in the Angular ecosystem while enjoying jqWidgets’ rich UI component library.
Angular is one of the most popular frameworks for building robust, scalable web applications. To accelerate UI development and ensure consistent design patterns, developers often turn to Angular component libraries. These libraries provide pre-built UI widgets such as grids, charts, forms, dialogs, and more — helping you ship apps faster with less reinvented code.
Whether you’re building an enterprise dashboard, admin portal, or consumer web app, here’s a rundown of the top Angular UI libraries you should consider.
1. Angular Material
Best for: Standardized UI + Google-style UX
Angular Material is the official UI component library from the Angular team. It implements Google’s Material Design guidelines and integrates deeply with Angular features like forms, navigation, and animations.
- Native Angular components (no jQuery)
- Excellent accessibility support
- Great for basic app layouts and UI consistency
Trade-offs: Fewer rich enterprise data components (e.g., advanced data grids)
2. HTMLElements / Smart UI for Angular
Best for: Full enterprise UI suite with visualization tools
Smart UI for Angular — available at htmlelements.com — is a commercial Angular UI library powered by jqwidgets.com technology. It offers more than 70 UI components natively built for Angular.
- Over 70 UI components including Grid, Scheduler, Charts, Gantt, Kanban, and Rich Text Editor
- Material and Bootstrap themes out of the box
- Built-in accessibility, localization (i18n), and RTL support
- Supports Angular CLI, Theme Builder, and granular configuration
Note: Smart UI for Angular is a commercial product, though free community versions and 30-day trials are available.
3. Syncfusion Angular UI Components
Best for: Data-intensive enterprise apps
- Large suite of enterprise widgets
- Touch-friendly components and responsive design
- Strong support for PDF/Excel export
Trade-offs: Can bloat bundle size if used without tree-shaking
4. PrimeNG
Best for: Rich open-source UI components
- Broad component coverage: charts, forms, inputs, pickers, overlays
- Supports Material, Bootstrap themes, and layout utilities
Trade-offs: Component API complexity can rise with customizations
5. Kendo UI for Angular
Best for: Enterprise-grade UI & tooling
- Excellent documentation and support
- Deep theming capabilities (Material, Bootstrap, custom)
- Built-in solutions for large data sets and performance tuning
Trade-offs: Commercial licensing (free trials available)
6. DevExtreme Angular Components
Best for: Complex data visualization and business logic
- Strong focus on performance and scalability
- Works well in data-heavy Angular applications
Trade-offs: Smaller Angular community compared to some alternatives
7. NG Bootstrap
Best for: Bootstrap-style Angular components
- No jQuery dependency
- Modular and lightweight
Trade-offs: Doesn’t include advanced widgets like grids/charts
8. Other Noteworthy Mentions
- NG-ZORRO: Ant Design for Angular, great for enterprise apps with a polished design system
- Nebular: Flexible library with built-in auth and dashboard components
- Clarity: Enterprise UX-focused components by VMware
Summary: Choosing the Right Library
| Library |
License |
Best Use Case |
| Angular Material |
Free |
Standard Angular UI |
| HTMLElements (Smart UI) |
Paid/Trial |
Full-stack enterprise UI |
| Syncfusion |
Paid/Trial |
Data-intensive applications |
| PrimeNG |
Free |
Feature-rich open-source UI |
| Kendo UI |
Paid/Trial |
Enterprise-grade UI |
| DevExtreme |
Paid/Trial |
Analytics dashboards |
| NG Bootstrap |
Free |
Bootstrap-aligned UI |
👉 When picking a library, consider your project’s complexity, performance needs, and whether you prefer open-source flexibility or structured enterprise tooling.
In 2025, data is the lifeblood of web applications. From real-time analytics dashboards to collaborative enterprise platforms, the ability to display, manipulate, and interact with large datasets efficiently defines user experience and developer productivity. JavaScript data grids have evolved far beyond simple HTML tables—they now support virtualization, inline editing, conditional formatting, real-time updates, and seamless integration with modern frameworks like React, Angular, Vue, and Svelte.
At jQWidgets, we’ve been building high-performance UI components for over a decade, and our flagship products—jqxGrid and Smart.Grid—continue to lead the industry in flexibility, speed, and developer experience. In this in-depth guide, we rank the top 10 best JavaScript data grids based on performance benchmarks, feature completeness, framework support, accessibility, customization depth, and real-world adoption.
Whether you’re building a financial trading platform, a CRM system, or a data-heavy admin panel, this list will help you choose the right tool. Let’s dive in.
1 jqxGrid: The Gold Standard in Enterprise Data Grids
jqxGrid from jQWidgets tops our list—and for good reason. It’s not just a grid; it’s a full-featured data management platform trusted by Fortune 500 companies worldwide.
With support for over 1 million rows via virtual scrolling, adaptive column resizing, multi-level grouping,inline editing, Excel-style filtering, and PDF/Excel/CSV export, jqxGrid delivers desktop-grade functionality in the browser. Its data binding engine intelligently handles JSON, XML, and array sources with zero configuration.
Standout Features in 2025:
- AI-Powered Column Detection: Automatically identifies data types (currency, date, percentage) and applies appropriate formatting.
- Dark/Light Mode Themes: 20+ professionally designed themes with full CSS variable support.
- Accessibility: Compliance with keyboard navigation and screen reader optimization.
- Framework Integration: React, Angular, Vue Grid components
Performance
jqxGrid renders 100,000 rows in under 80ms on average hardware, thanks to its optimized DOM recycling and requestAnimationFrame-based rendering loop.
Code Example
<div id="jqxGrid"></div>

<script>
  const data = [
    { name: "Alice Johnson", sales: 45000, region: "North" },
    { name: "Bob Smith", sales: 62000, region: "West" }
  ];

  $("#jqxGrid").jqxGrid({
    source: data,
    theme: 'energyblue',
    columns: [
      { text: 'Name', datafield: 'name', width: 200 },
      { text: 'Sales', datafield: 'sales', cellsformat: 'c2', width: 120 },
      { text: 'Region', datafield: 'region' }
    ],
    pageable: true,
    virtualmode: true,
    rendergridrows: function() { return data; }
  });
</script>
Why #1? Unmatched balance of performance, features, and long-term support. Perfect for mission-critical applications.
2 Smart.Grid: The Future of Web-Native Data Grids
Also from jQWidgets, Smart.Grid redefines what a modern data grid should be. Built as a Web Component with zero dependencies, it works natively in any framework—or no framework at all.
Smart.Grid uses shadow DOM, CSS custom properties, and template-driven rendering, making it incredibly lightweight and themeable. It supports hierarchical data, drag-and-drop, conditional styling, formula evaluation, and touch gestures out of the box.
2025 Highlights:
- FAST Progressive Rendering: Only visible cells are rendered—ideal for mobile and low-powered devices.
- CHART Built-in Charting: Click a column to generate bar, line, or pie charts instantly.
- CRUD Command Column: Add Edit/Delete/Custom buttons with one line of config.
- Tree Data with lazy loading
- Full TypeScript Support
Performance
Loads 500,000 rows with sub-50ms interaction latency. Uses Web Workers for sorting and filtering to keep the UI thread responsive.
Code Example
<smart-grid id="grid"></smart-grid>

<script>
  const grid = document.getElementById('grid');
  grid.dataSource = [
    { product: "Laptop Pro", price: 1499, inStock: true },
    { product: "Tablet Air", price: 599, inStock: false }
  ];
  grid.columns = [
    { label: 'Product', dataField: 'product', template: 'text' },
    { label: 'Price', dataField: 'price', template: 'currency' },
    { label: 'Available', dataField: 'inStock', template: 'checkBox' }
  ];
  grid.paging = true;
  grid.sorting = true;
  grid.filtering = true;
</script>
Why #2? Perfect for modern SPAs, PW, and micro-frontend architectures. The most framework-agnostic grid available.
3 AG-Grid: Enterprise Powerhouse with Open Core
AG-Grid remains a titan in the JavaScript grid space. Its Community Edition is free and feature-packed, while the Enterprise Edition adds pivoting, server-side row model, and advanced clipboard support.
Key Strengths:
- Row Grouping & Aggregation with live summaries
- Integrated Charting API
- Tree Data with lazy loading
- Full TypeScript Support
Performance Note:
Handles 1M+ rows via the Server-Side Row Model, delegating sorting/filtering to the backend.
Ideal For: Large-scale analytics platforms where data lives on the server.
4 Kendo UI Grid: Polished and Production-Ready
Telerik’s Kendo UI Grid offers a premium experience with deep integration into Angular, React, and Vue. It includes batch editing, frozen columns, detail templates, and responsive design by default.
2025 Additions:
- Adaptive Rendering: Switches to mobile-optimized layout automatically
- AI Anomaly Highlighting: Flags outliers in numeric columns
Best For: .NET and Java enterprise teams needing rapid development.
5 Ext JS Grid (Sencha): Desktop-Class Richness
Sencha Ext JS delivers the most desktop-like grid experience in the browser. With buffered rendering, lockable columns, and widget columns, it’s built for complex UIs.
Standout Features:
- Spreadsheet Selection Mode
- Infinite Scrolling
- MVC Architecture Support
Use Case: Internal business tools mimicking Windows desktop apps.
6 Handsontable: Excel in the Browser
Handsontable is the closest you’ll get to Microsoft Excel in JavaScript. It supports formulas, cell merging, comments, and undo/redo stacks.
2025 Updates:
- Web Worker Formula Engine
- Collaborative Editing via ShareDB
Perfect For: Financial modeling, budget planners, and data entry forms.
7 Tabulator: Lightweight, Modular, and Fast
Tabulator is a free, open-source grid with a clean API and modular design. You only load the features you need.
Key Features:
- Responsive Layouts
- Custom Formatters
- Download as CSV/JSON
Great For: Prototyping, dashboards, and lightweight admin panels.
8 DataTables: The jQuery Classic, Still Going Strong
DataTables remains popular for its simplicity and vast plugin ecosystem. It adds pagination, search, and sorting to any HTML table in minutes.
Modern Twist:
Now supports responsive extensions and server-side processing.
Ideal For: Legacy jQuery projects or WordPress plugins.
9 RevoGrid: Built for Scale
RevoGrid is an MIT-licensed grid optimized for massive datasets. It uses virtual DOM diffing and CSS Grid for layout.
Highlights:
- 10M+ Row Support
- Excel-Style Copy/Paste
- GPU-Accelerated Sorting (Beta)
Use Case: Log viewers, IoT dashboards, and big data explorers.
10 Grid.js: Minimalist and Modern
Grid.js is a tiny (~15KB) grid with React, Vue, and Svelte support. It focuses on simplicity and performance.
Features:
- Server-Side Pagination
- Search & Sort
- Custom Cell Templates
Best For: Static site generators, documentation portals, and small apps.
Comparison Table: At a Glance
| Rank |
Grid |
Framework |
Virtualization |
Editing |
Export |
Real-Time |
Accessibility |
| 1 |
jqxGrid |
All |
Yes |
Yes |
Yes |
Yes |
High |
| 2 |
Smart.Grid |
All |
Yes |
Yes |
Yes |
Yes |
WCAG 2.2 |
| 3 |
AG-Grid |
All |
Yes |
Yes |
Yes |
Yes |
WCAG 2.2 |
| 4 |
Kendo UI |
All |
Yes |
Yes |
Yes |
Yes |
High |
| 5 |
Ext JS |
All |
Yes |
Yes |
Yes |
Yes |
High |
| 6 |
Handsontable |
All |
Yes |
Yes |
Yes |
Yes |
Medium |
| 7 |
Tabulator |
Vanilla |
Yes |
Yes |
Yes |
No |
Medium |
| 8 |
DataTables |
jQuery |
Yes |
Yes |
Yes |
No |
Medium |
| 9 |
RevoGrid |
All |
Yes |
Yes |
Yes |
No |
Medium |
| 10 |
Grid.js |
All |
Yes |
No |
Yes |
No |
Low |
How to Choose the Right Grid for Your Project
- Data Volume > 100K rows? → Use jqxGrid, Smart.Grid, or AG-Grid with virtualization.
- Need Excel-like editing? → Handsontable or jqxGrid.
- Framework-first development? → Smart.Grid (Web Components) or Kendo UI.
- Budget-conscious startup? → Tabulator, DataTables, or Grid.js.
- Real-time collaboration? → Smart.Grid with WebSocket sync.
Smart.Table is Now Free & Open-Source: Power Your Data UIs
🎉 Big news, developers! We’re thrilled to announce that Smart.Table, our battle-tested Web Component for building powerful data tables, is now completely free and open-source under the Apache 2.0 license! 🚀 As part of the Smart UI Community Edition, Smart.Table is ready to supercharge your dashboards, admin panels, and data-driven apps—without costing a dime.
At jQWidgets, we’ve spent over a decade crafting UI tools that empower developers worldwide, from Fortune 500 companies to indie creators. Today, we’re giving back to the community by open-sourcing Smart.Table, making its enterprise-grade features accessible to everyone. Whether you’re building with React, Angular, Vue, Blazor, or vanilla JavaScript, Smart.Table is your go-to for creating blazing-fast, responsive, and customizable data tables.
Why Smart.Table?
Smart.Table isn’t just another table library—it’s a lightweight, framework-agnostic Web Component that enhances the native HTML <table> with enterprise-level capabilities. Designed for simplicity and performance, it’s perfect for modern web apps, from small-scale projects to complex enterprise systems.
Key Features
- Advanced Filtering 🔍: Filter rows with intuitive filter rows or input-based search.
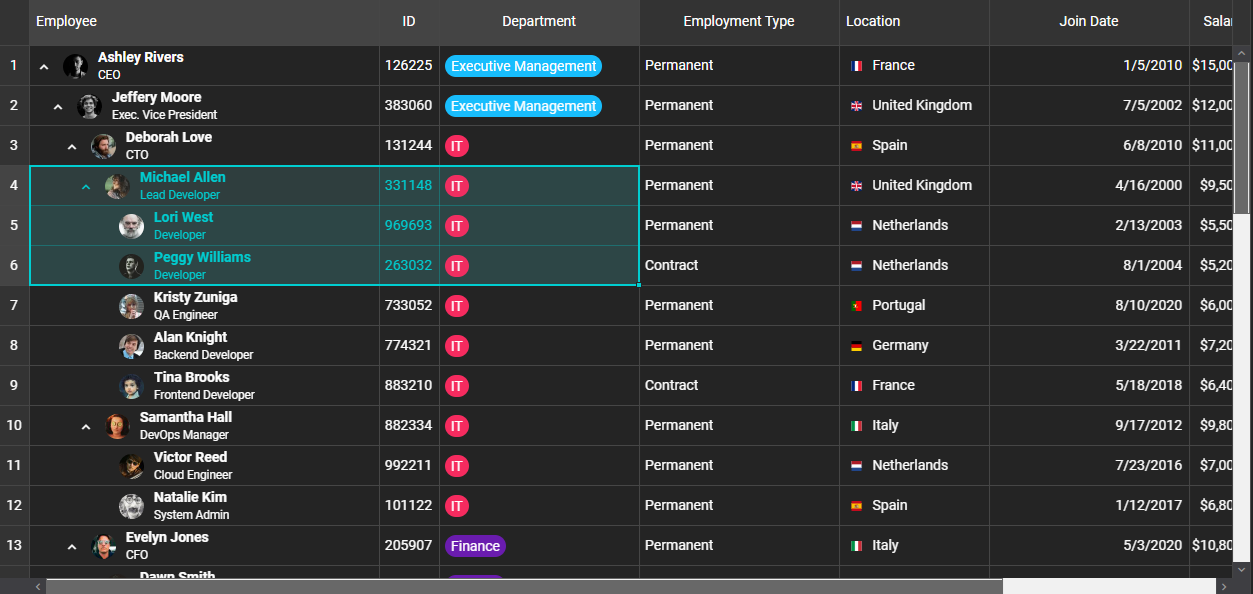
- Multi-Column Sorting 📈: Sort data across multiple columns with custom logic.
- Grouping & Tree Tables 📚: Organize hierarchical data with collapsible groups and expandable rows.
- Inline Editing ✏️: Edit cells and rows with built-in validation.
- Virtualization ⚡: Handle massive datasets with smooth scrolling (Enterprise upgrade for advanced use).
- Data Export 📊: Export to Excel, PDF, CSV, TSV, and HTML (Excel/PDF in Enterprise).
- Responsive Design 📱: Adaptive layouts for desktop, tablet, and mobile with sticky headers/columns.
- Accessibility ♿: WAI-ARIA compliant with full keyboard navigation.
- Customizable Themes 🎨: Supports Bootstrap, Material, and custom CSS for seamless branding.
- Column Reordering: Drag-and-drop columns for dynamic layouts.
Smart.Table is lightweight (~50-100KB minified), dependency-free, and integrates effortlessly with Angular, React, Vue, Blazor, or vanilla JavaScript. It’s been battle-tested in real-world applications, powering dashboards for startups, universities, and global enterprises.
Why Open-Source?
At jQWidgets, we believe in empowering the developer community. By making Smart.Table open-source under Apache 2.0, we’re removing barriers and inviting you to:
- Fork and Customize: Tailor Smart.Table to your project’s needs.
- Contribute: Join our community to add features, fix bugs, or share ideas.
- Deploy Freely: Use it in personal or commercial projects with no restrictions.
This move aligns with our mission to deliver enterprise-grade tools that are accessible to all. Smart.Table’s open-source release is a step toward fostering innovation and collaboration in the Web Components ecosystem.
Get Started with Smart.Table
Installation
Install via npm for modern JavaScript projects:
npm install smart-table-community
Or use the CDN for quick setups:
<script src="https://cdn.jsdelivr.net/npm/smart-table-community/source/modules/smart.table.js"></script>
<link rel="stylesheet" href="https://cdn.jsdelivr.net/npm/smart-table-community/source/modules/styles/smart.default.css" />
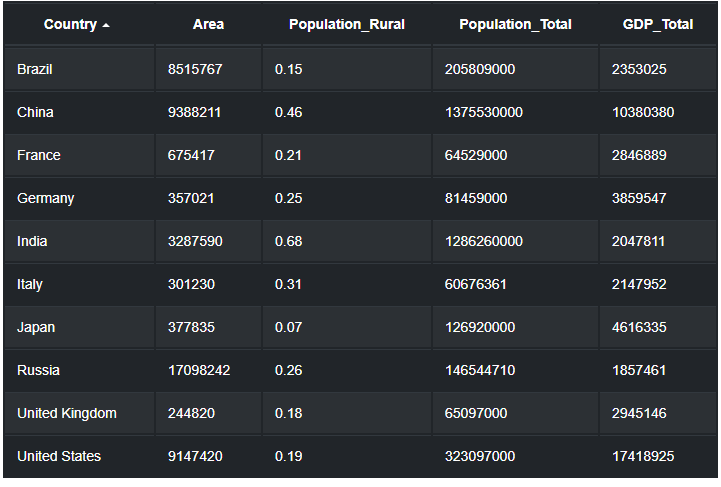
Basic Example
Create a responsive table in minutes:
<smart-table>
  <table>
    <thead>
      <tr>
        <th scope="col">Country</th>
        <th scope="col">Area (km²)</th>
        <th scope="col">Population</th>
        <th scope="col">GDP (USD)</th>
      </tr>
    </thead>
    <tbody>
      <tr><td>Brazil</td><td>8515767</td><td>205809000</td><td>2353025</td></tr>
      <tr><td>China</td><td>9388211</td><td>1375530000</td><td>10380380</td></tr>
      <tr><td>France</td><td>675417</td><td>64529000</td><td>2846889</td></tr>
    </tbody>
  </table>
</smart-table>
Explore advanced configurations in our Documentation.
Try It Out
See Smart.Table in action with our interactive demos:
Why This Matters
Smart.Table’s open-source release is a game-changer for developers building data-heavy applications. Compared to alternatives like AG-Grid, Smart.Table offers a lighter footprint and zero-cost access to core enterprise features, with optional upgrades for advanced needs (starting at ~$399 for the full Smart UI suite). Its Web Component architecture ensures future-proof compatibility and easy integration, whether you’re crafting a Blazor app for .NET or a React dashboard.
We’re excited to see what you build with Smart.Table. From startups to enterprises, let’s create the next generation of data UIs together! 💪 Drop a comment below or tag us on X with your projects using #SmartTable.
Links:
Tags: #WebComponents #OpenSource #DataTable #EnterpriseUI #jQWidgets #JavaScript #React #VueJS #Angular #Blazor #UIComponents #Frontend #MaterialDesign #ResponsiveDesign
Posted in:
ANGULAR, ANGULAR GRID, JavaScript, JavaScript UI, JavaScript Widgets, React, react grid, React Javascript Library, REACTJS, typescript, VUE, VUEJS
Tagged:
freelancers, open source, opensource, smart.table, startups, table
Elevate Your Project with the New jQWidgets Component License!
We’re thrilled to announce the launch of the Component License for jQWidgets, now available for just $199! Exclusively on https://www.jqwidgets.com/license/, this license empowers developers to select a single, high-performance component to create tailored, standout applications with precision.
Pick Your Perfect Component
Choose one of our industry-leading components:
- Grid: Build dynamic, data-driven interfaces.
- Chart: Craft stunning, interactive visualizations.
- Scheduler: Streamline event management with ease.
- Editor: Create rich, user-friendly content editing.
- Kanban: Optimize workflows with intuitive task management.
- Gantt Chart: Master project timelines with powerful tools.
Why Choose the Component License?
- Precision Fit: License one component to match your project’s needs.
- Affordable Excellence: Access premium quality for only $199.
- Distinctive Edge: Leverage jQWidgets’ proprietary technology to build applications that competitors can’t replicate.
Get Started Now
Ready to transform your development? Visit License – Angular, Vue, React, Web Components, Javascript, HTML5 Widgets to explore the Component License or contact our sales team for details. Start building smarter today!
Thank you for choosing jQWidgets!
Best,
The jQWidgets Team
Posted in:
ANGULAR, ANGULAR GRID, angular tree, ASP .NET, Chart, custom elements, Grid, html elements, JavaScript, JavaScript Plugins, JavaScript UI, JavaScript UI Plugins, JavaScript UI Widgets, JavaScript Widgets, jQuery, jQuery Plugins, jQuery UI, jQuery UI Plugins, jQuery UI Widgets, jQuery Widgets, jQWidgets, jqxButton, jqxCalendar, jqxChart, jqxCheckBox, jqxComboBox, jqxDateTimeInput, jqxDock, jqxDropDownList, jqxExpander, jqxGrid, jqxInput, jqxListBox, jqxMaskedInput, jqxMenu, jqxNavigationBar, jqxNumberInput, jqxProgressBar, jqxRadioButton, jqxRating, jqxResponse, jqxRibbon, jqxScrollBar, jqxSlider, jqxSplitter, jqxTabs, jqxTooltip, jqxTree, jqxTreeMap, jqxValidator, jqxWindow, PHP, Pivot Grid, React, react grid, React Javascript Library, REACTJS, typescript, VUE, VUEJS
jQWidgets v24.0.0 Release
Release Date: September 17, 2025


What’s New
-
New
Tailwind Theme: A new Tailwind CSS-based theme has been introduced, providing a modern, utility-first approach to styling.
This allows developers to quickly customize UI components using Tailwind’s classes, improving design consistency and reducing the need for custom CSS overrides.
-
New
React 19.1 Support: All React components are now fully compatible with React 19.1.
This ensures smooth integration with the latest React hooks and features, providing better performance, updated lifecycle handling, and seamless updates when building modern React applications.
What’s Fixed
-
Fixed
jqxGrid Resizing: The grid now correctly adjusts its size when the container changes.
This ensures a fully responsive grid layout, avoiding clipping or empty space issues when the browser window is resized or the container dynamically changes size.
-
Fixed
jqxGrid Checkbox Selection: Checkbox selections now remain accurate after filtering.
Previously, selected rows could appear unselected when filters were applied. Now, users can reliably maintain their selections even when filtering large datasets.
-
Fixed
jqxGrid DropdownList & CheckedList Filters: Rendering issues with dropdown and checked list filters have been resolved.
Filters now display correctly, and users can interact with them without layout glitches, ensuring consistent and intuitive filtering functionality.
-
Fixed
jqxGrid Scroll Position: Scroll position is now preserved correctly after sorting operations.
This enhances user experience when sorting large grids, allowing users to continue browsing from their previous scroll position without unexpected jumps.
-
Fixed
jqxExpander Header Position: Dynamically updating the headerPosition property now refreshes the UI correctly.
This ensures the expander component consistently displays the header in the intended position, improving layout reliability during dynamic updates.
-
Fixed
jqxDateTimeInput Parsing: Copy-paste issues with different date formats have been resolved.
Users can now paste dates in multiple formats into the input without parsing errors, ensuring better cross-format support and reducing data entry frustration.
-
Fixed
jqxButton Disabled State: Dynamic updates to button disabled states now work reliably.
When buttons are programmatically enabled or disabled, the styling and behavior correctly reflect their state, avoiding inconsistent UI behavior.
-
Fixed
jqxButtonGroup Disabled State: Disabling a button group dynamically now correctly disables all buttons in the group.
This prevents users from interacting with buttons that should be inactive, ensuring consistent group behavior.
-
Fixed
General UI Stability Improvements: Minor bug fixes and performance improvements have been applied across multiple components.
These enhancements improve rendering smoothness, interaction responsiveness, and overall stability of the jQWidgets UI components.
Posted in:
ANGULAR, ANGULAR GRID, ASP.NET Core Tag Helpers, Chart, Grid, html elements, JavaScript, JavaScript Plugins, JavaScript UI, JavaScript UI Plugins, JavaScript UI Widgets, JavaScript Widgets, jQuery, jQuery Plugins, jQuery UI, jQuery UI Plugins, jQuery UI Widgets, jQuery Widgets, jQWidgets, jqxButton, jqxCalendar, jqxChart, jqxGrid, jqxInput, jqxListBox, jqxMaskedInput, jqxMenu, jqxNavigationBar, jqxNumberInput, jqxProgressBar, jqxRadioButton, jqxRating, jqxResponse, jqxRibbon, jqxScrollBar, jqxSlider, jqxSplitter, jqxTabs, jqxTree, jqxTreeMap, jqxValidator, jqxWindow, PHP, Pivot Grid, React, react grid, React Javascript Library, REACTJS, typescript, VUE, VUEJS
What’s New
- Localizations for all components
A brand-new locales folder ships with the Smart UI library, providing ready-to-use translations for 20 languages. This enables developers to quickly build globally accessible applications without manually managing localization strings.
- Gantt Chart Critical Path
Critical Path visualization is now available in the Gantt Chart, helping project managers instantly identify the sequence of dependent tasks that directly affect project timelines.
- Grid Spreadsheet Extensions
The Data Grid now supports familiar spreadsheet-like formatting tools: Bold, Italic, Underline, Strikethrough, as well as background and text color for cells. Users can style data interactively, making it easier to highlight and interpret key information.
- Grid Transpose
Quickly flip rows into columns (and vice versa) with the new Grid Transpose feature. Perfect for data pivoting and presenting datasets from multiple perspectives.
- Grid Number Input Editor
Introducing a dedicated Number Input editor in the Grid, complete with a numeric keypad for mobile devices. This streamlines data entry on touchscreens, making the grid more mobile-friendly.
- Grid Column Placeholders
Placeholders can now be defined for Grid columns, offering users contextual hints and improving form-like data entry.
- Grid AI Filtering
Experimental AI-powered filtering makes it possible to query and filter data using natural language, reducing complexity and improving user experience.
What’s Improved
- Comprehensive Documentation
The Smart UI Library documentation has been completely revised and expanded. Every component now includes full coverage of API members — properties, methods, and events — with updated descriptions, use cases, and examples. Whether you work in Angular, React, Vue, Blazor, or JavaScript, you’ll now find clearer, more actionable guidance.
- Editor Custom CSS
Developers can now inject custom styles directly into the Smart Editor’s content through the new content_css property, making it easier to enforce brand guidelines and create visually consistent documents.
What’s Fixed
- Accordion: Corrected layout recalculation when dynamically inserting new items.
- Breadcrumb: Fixed issue with adding items via
appendChild.
- ButtonGroup: Improved initialization for native HTML
<button> elements.
- Calendar: Tooltip positioning has been corrected for better accuracy.
- CardView: API-driven filtering now works as expected.
- Carousel: Proper initialization when built from a list of
<div> tags or images.
- CheckInput:
checked property now correctly applies to all items.
- ComboBox:
sortDirection now sorts items properly.
- DateRangeInput: Value retrieval works correctly when returned as an object.
- DockingLayout: Adding and removing items dynamically now functions without layout glitches.
Posted in:
ANGULAR, ANGULAR GRID, Chart, custom elements, Grid, html elements, JavaScript, JavaScript Plugins, JavaScript UI, JavaScript UI Plugins, JavaScript UI Widgets, JavaScript Widgets, jQWidgets, PHP, Pivot Grid, React, react grid, React Javascript Library, REACTJS, typescript, VUE, VUEJS
|
|