The Case of the Ever-Increasing SYSTEM Handle Count

Update – Dec. 8, 2025: I got some feedback from a member of the Windows File Systems Team. They can reproduce the issue and also pointed out the leaking driver is not enabled in most cases:

Wcifs only gets attached if there are specific applications/services that use it: like Windows Containers (including server containers, Windows Sandbox, etc), or certain Gamepass for PC games.


This is an homage to the old “The Case of’…” series Mark Russinovich used to write (and later present), that demonstrated the power of the Sysinternals tools. Tools like Process Monitor, Process Explorer and Handle are still very relevant today but there are times when they can’t quite do all the heavy lifting and you just don’t have the time to spend hours or days on a problem.

In this case, my laptop had an intermittent handle leak in the SYSTEM process. Catching the leaking entity in the act is difficult without some sort of scripting, and scripting takes time.

This appears to be a fruitful area for LLMs to assist: they are better than me at Python, they are pretty good at small projects, and even if there is a bug, the code will never be shipped to a customer.

SYSTEM Handle Count Out of Control

My dev laptop was running quite sluggishly last week and, after poking around Task Manager, I noticed the handle count in the SYSTEM process was close to 5 million handles! This number is absurdly high, and is either a leak or a very badly behaved driver.

Why does it matter? Handles are associated with kernel objects and kernel objects take up memory. In my case, the non-paged pool usage on my system was over 9GB!

I didn’t have much of a hypothesis, though one important detail about the SYSTEM process: its threads all run in kernel mode. So, any handle leak in the SYSTEM process has to come from a kernel component.

I gathered a bit more data using Handle:

C:\Windows\System32>handle -p 4 -s
Nthandle v5.0 - Handle viewer
Copyright (C) 1997-2022 Mark Russinovich
Sysinternals - www.sysinternals.com

Handle type summary:
ALPC Port : 186
...
File : 4980368

Almost five million file handle leaks. Tracking down file handle leaks can be really tough because there is just so much file activity on a modern Windows machine.

Next, I took a look in Process Explorer to see if I could spot any patterns. It’s hard to scroll through 5 million handles, but I did notice that many of them were coming from the WinSxs directory.

A Watched Kettle…

I monitored the handle count on the SYSTEM process for a few minutes and it wasn’t budging. It was 11:30 pm at this point and so I asked Claude to help:

Write a Python script that monitors the handle count in the Windows 11 SYSTEM process. Output the handle count every 30 seconds, along with the timestamp.

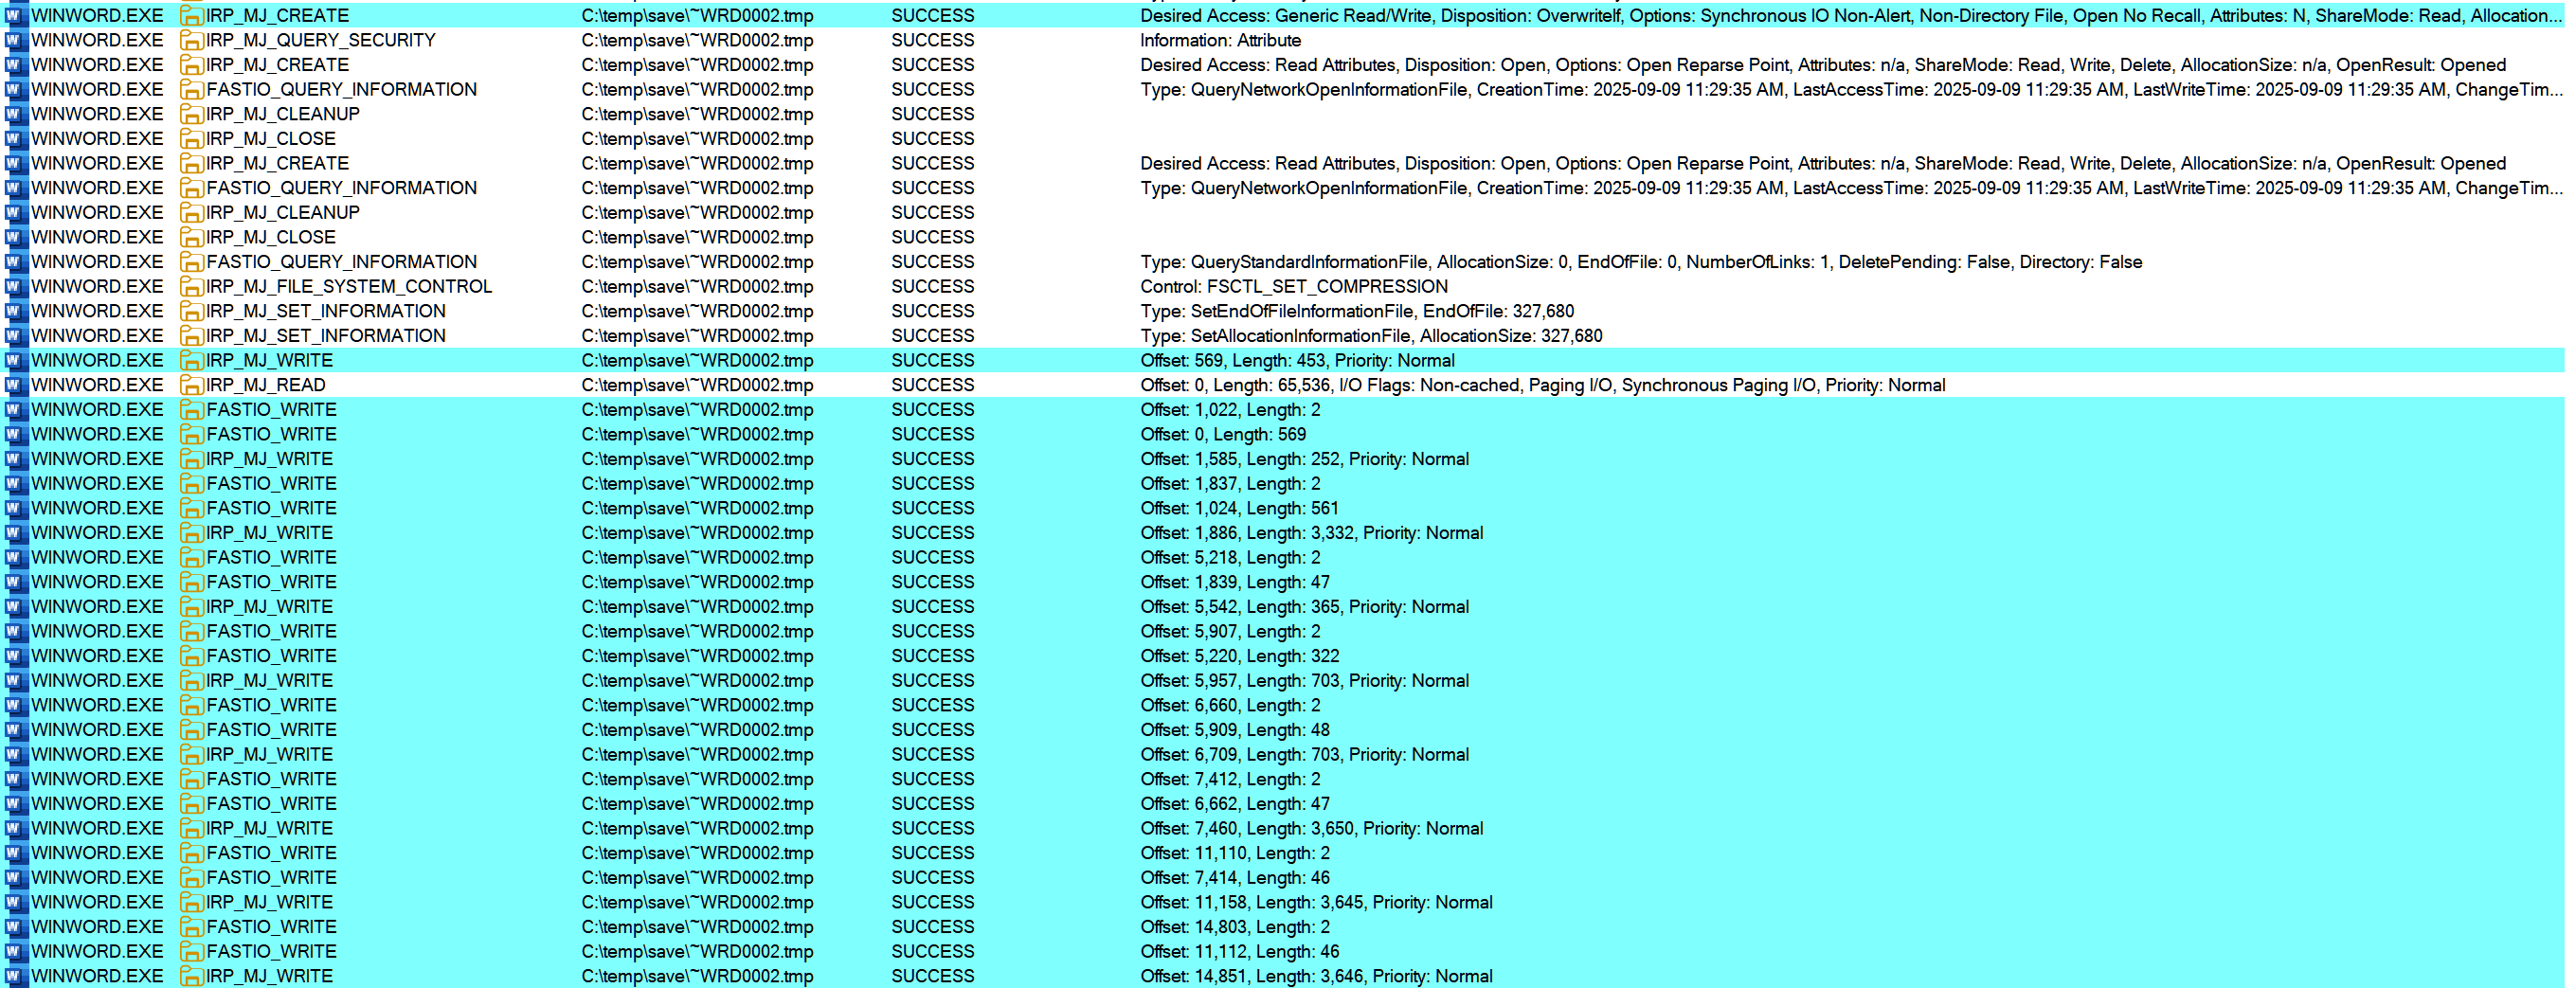
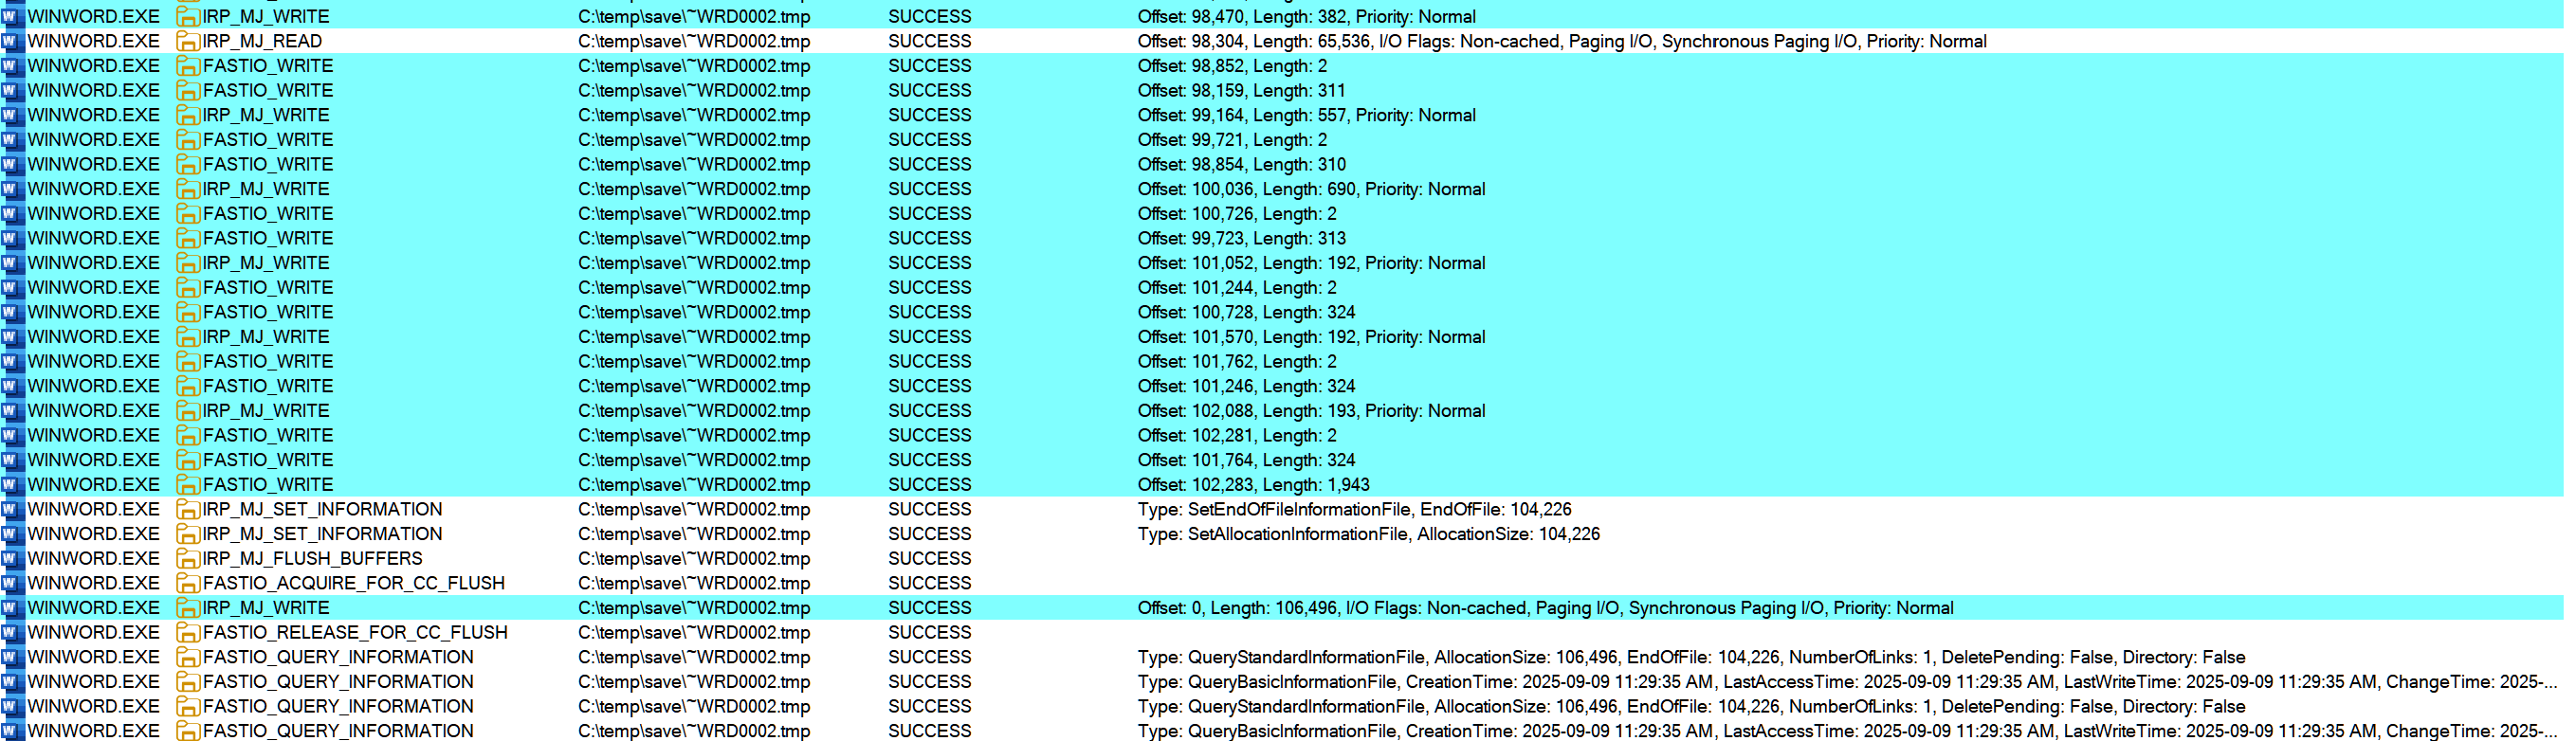
I ran this and also started Procmon with a restrictive filter to only monitor file CREATEs (open) and file CLEANUPs (close) in the SYSTEM process. This turned out to be useless data: for security, file handles opened in kernel live in the SYSTEM process handle table, BUT kernel drivers run inline in arbitrary processes. Just monitoring the SYSTEM process is not very useful.

An Unwatched Kettle…

I woke up the next day, hoping for a hot cup of tea, but ending up disappointed. On the positive side, Claude’s script worked well. I could see periods where the handle count went up significantly.

On the downside, the Procmon trace revealed nothing interesting. I ran it the next night and observed the same thing, around the same time.

2025-11-20 01:12:45 handles=10130
2025-11-20 01:13:15 handles=10451
2025-11-20 01:13:45 handles=11534
2025-11-20 01:14:15 handles=12617
2025-11-20 01:14:45 handles=13803
2025-11-20 01:15:15 handles=15092
2025-11-20 01:15:45 handles=16424
2025-11-20 01:16:15 handles=17541
2025-11-20 01:16:45 handles=18613
2025-11-20 01:17:15 handles=19659
2025-11-20 01:17:45 handles=20740
2025-11-20 01:18:15 handles=21930
2025-11-20 01:18:45 handles=23210
2025-11-20 01:19:15 handles=23982
2025-11-20 01:19:45 handles=28911
2025-11-20 01:20:15 handles=34885
2025-11-20 01:20:45 handles=39735
2025-11-20 01:21:15 handles=43154
2025-11-20 01:21:45 handles=44380
2025-11-20 01:22:15 handles=45831
2025-11-20 01:22:45 handles=46990
2025-11-20 01:23:15 handles=47557
2025-11-20 01:23:45 handles=47573
2025-11-20 01:24:15 handles=47595
2025-11-20 01:24:45 handles=47578
2025-11-20 01:25:15 handles=47559
2025-11-20 01:25:45 handles=47567

I’m not sure if I would have even gotten this far without an LLM assisting. I *could* have written a similar script but I just don’t think I would have spent the time to do so, unless it was part of my daily work. And even if I had gotten this far, I would not have gone any further.

Here’s the interesting part: instead of mulling over what the *problem* might be, my brain was mulling over what I could ask the LLM to do to help me. And when it came to me on Saturday morning when I was making muffins (the ‘shower’ effect), it again only took a couple of minutes for Claude to modify my initial script.

I needed to catch the leaking kernel component in the act. Process Monitor might have been able to do the job (with the /runtime command) but I turned to the heavy hitter: Windows Performance Recorder, and it’s built in Handle profile.

I need help modifying this script.

In a 30 second window, if the handle count grows by more than 1000, I would like you to add the following logic:

- Start a wpr trace with the command:
Wpr.exe -start GeneralProfile -start Handle -filemode

- After one minute, stop the trace and save it to the c:\traces folder, creating the folder if it does not exist. For the next 60 minutes, even if the handle count grows by more than 1000, do not start a trace.

Finally, a Reproduction!

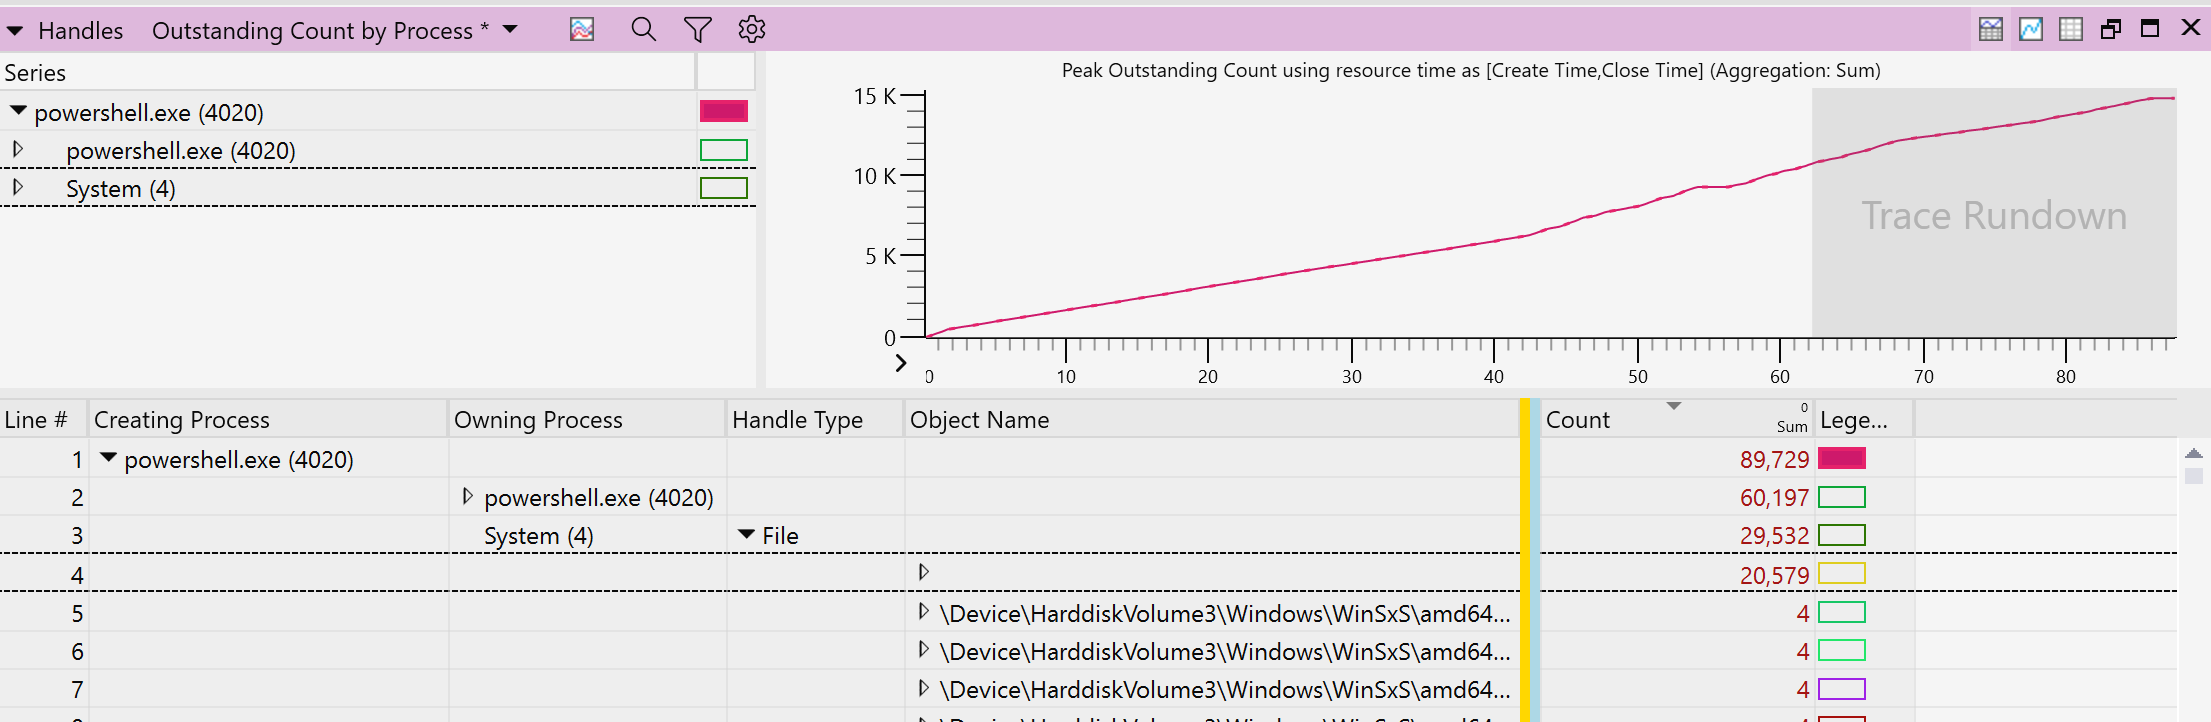
The next morning, I had a WPR trace ready to analyze. The handle data clearly showed that a Powershell process was triggering a bunch of handle creations in the SYSTEM process handle table. That’s not necessarily a smoking gun on its own, since I only ran the trace for one minute.

However, my monitoring script showed that the handle count never dropped back down, even after hours.

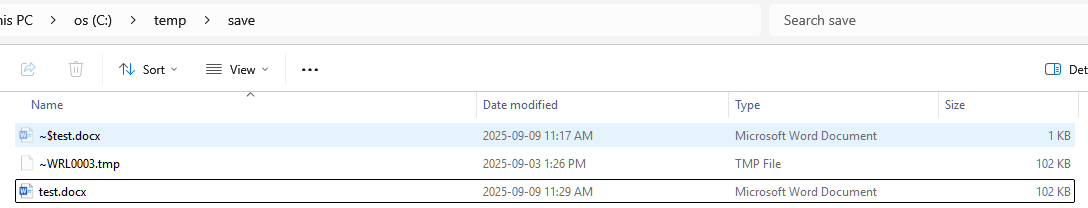
One other point: incidentally the filenames even matched my anecdotal observations – many were in the WinSxS folder.

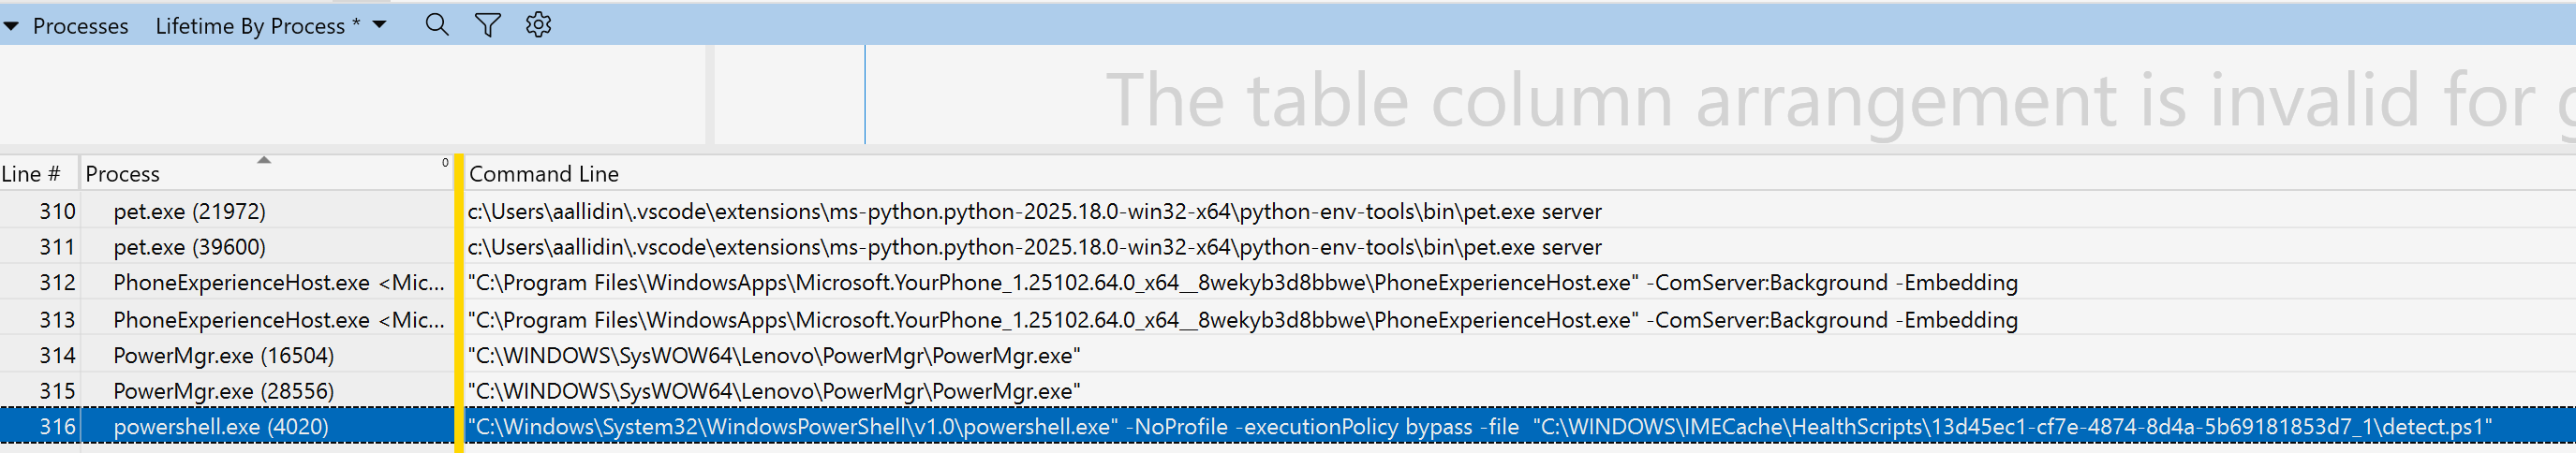
That instance of Powershell was (thankfully) executing a very short script:

[CmdletBinding()]
param()
	
$locations = @()
	
Get-PSDrive -p "FileSystem" | ForEach-Object {
     $locations += Get-ChildItem -Path "$($_.Root)" -Recurse -Name "_conda.exe" -Force
}
	
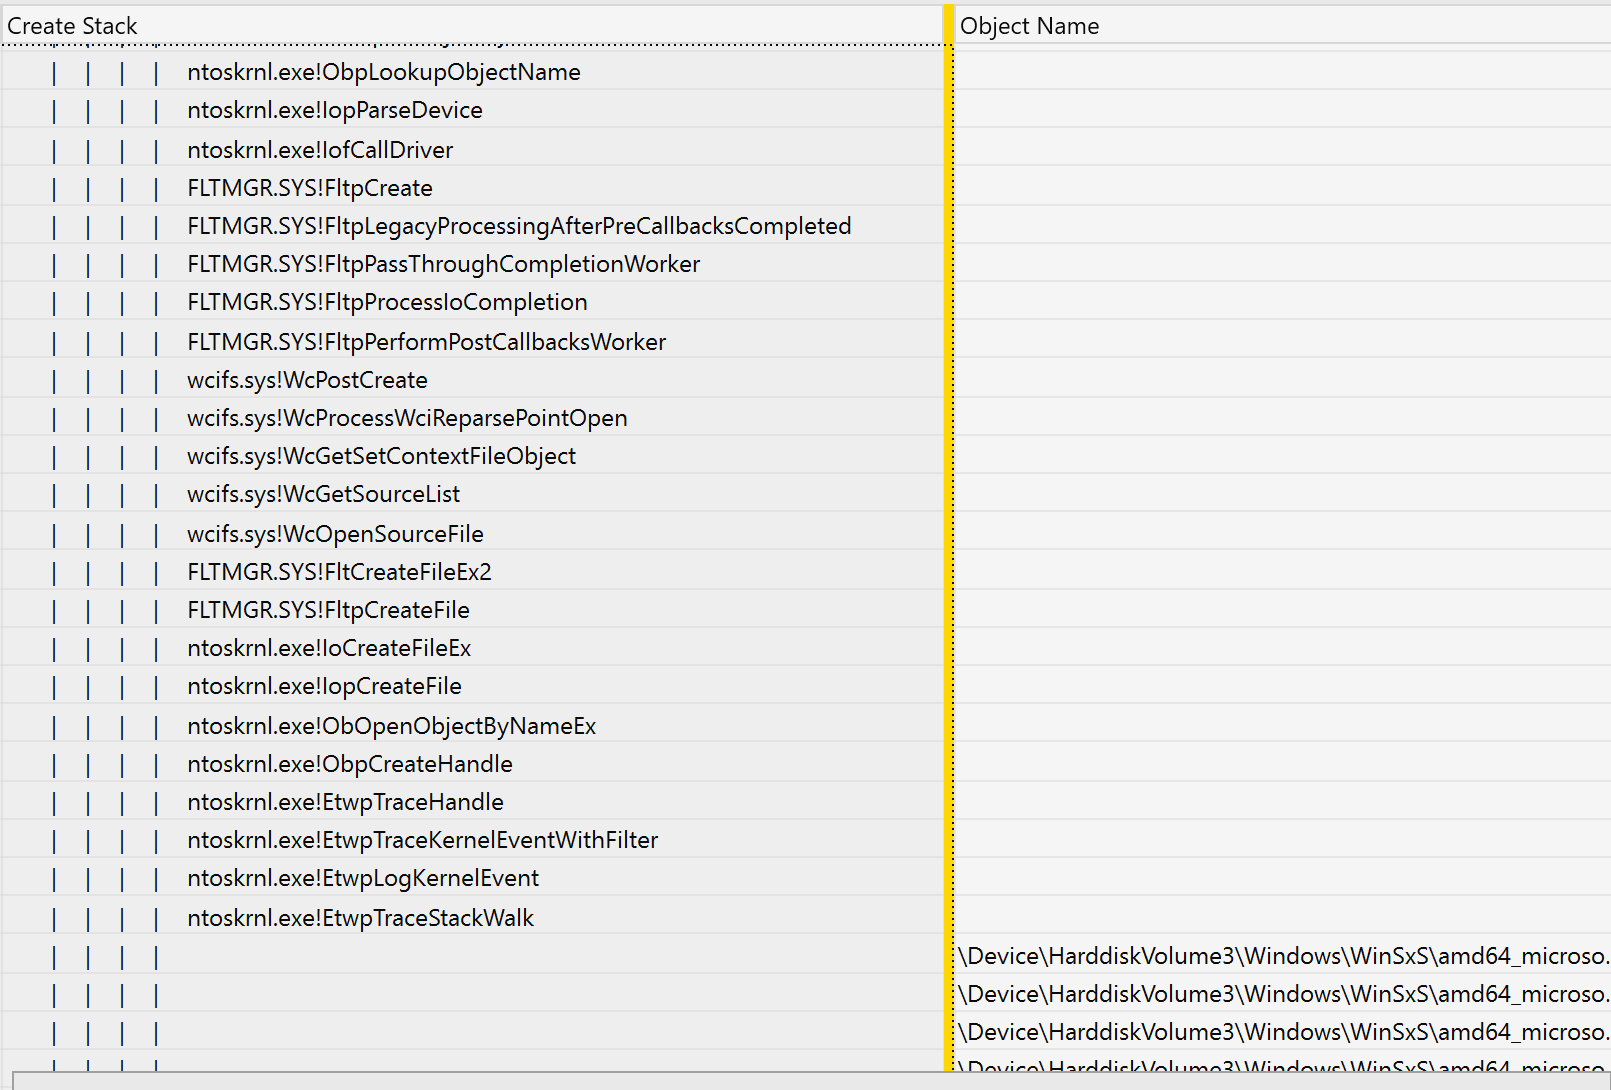
Write-Output $(ConvertTo-Json -InputObject $locations -Depth 100 -Compress)

The WPR trace also gave me the call stack at handle creation time, pointing to the Windows driver wcifs.sys:

Sigcheck v2.90 - File version and signature viewer
Copyright (C) 2004-2022 Mark Russinovich
Sysinternals - www.sysinternals.com

C:\Windows\System32\drivers\wcifs.sys:
        Verified:       Signed
        Signing date:   9:13 PM 9/25/2025
        Publisher:      Microsoft Windows
        Company:        Microsoft Corporation
        Description:    Windows Container Isolation FS Filter Driver
        Product:        Microsoft« Windows« Operating System
        Prod version:   10.0.26100.6725
        File version:   10.0.26100.6725 (WinBuild.160101.0800)
        MachineType:    64-bit

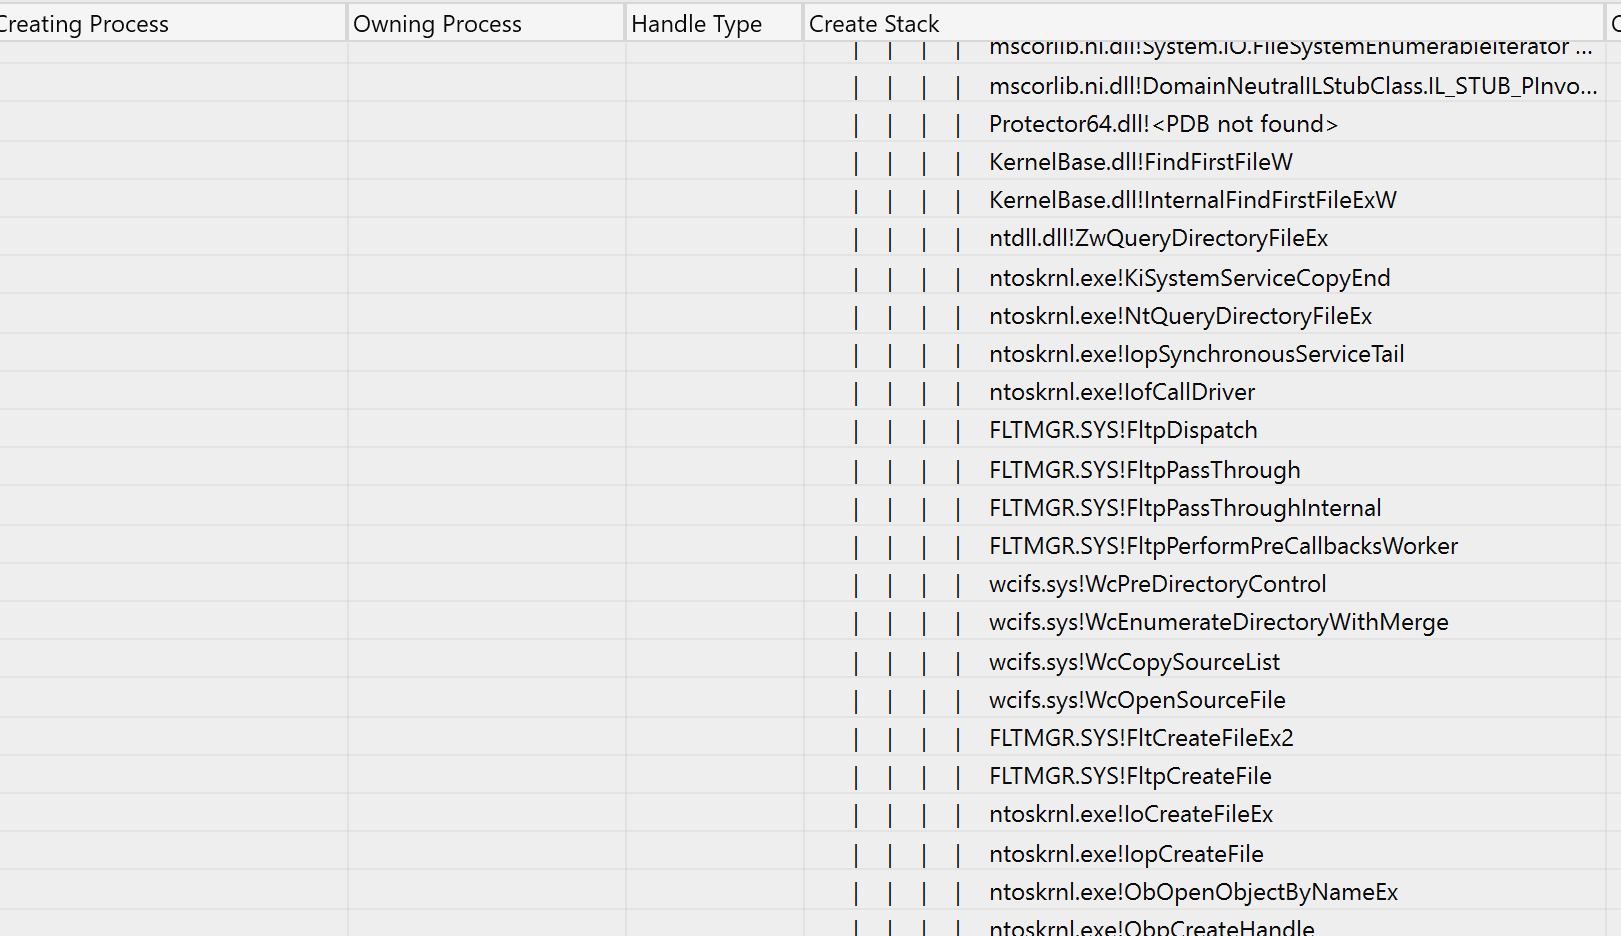
The Power and Curse of LLMs

At this point, I could reproduce at will by running the Powershell script.  Detaching wcifs from the filesystem eliminated the issue:

fltmc detach wcifs c:

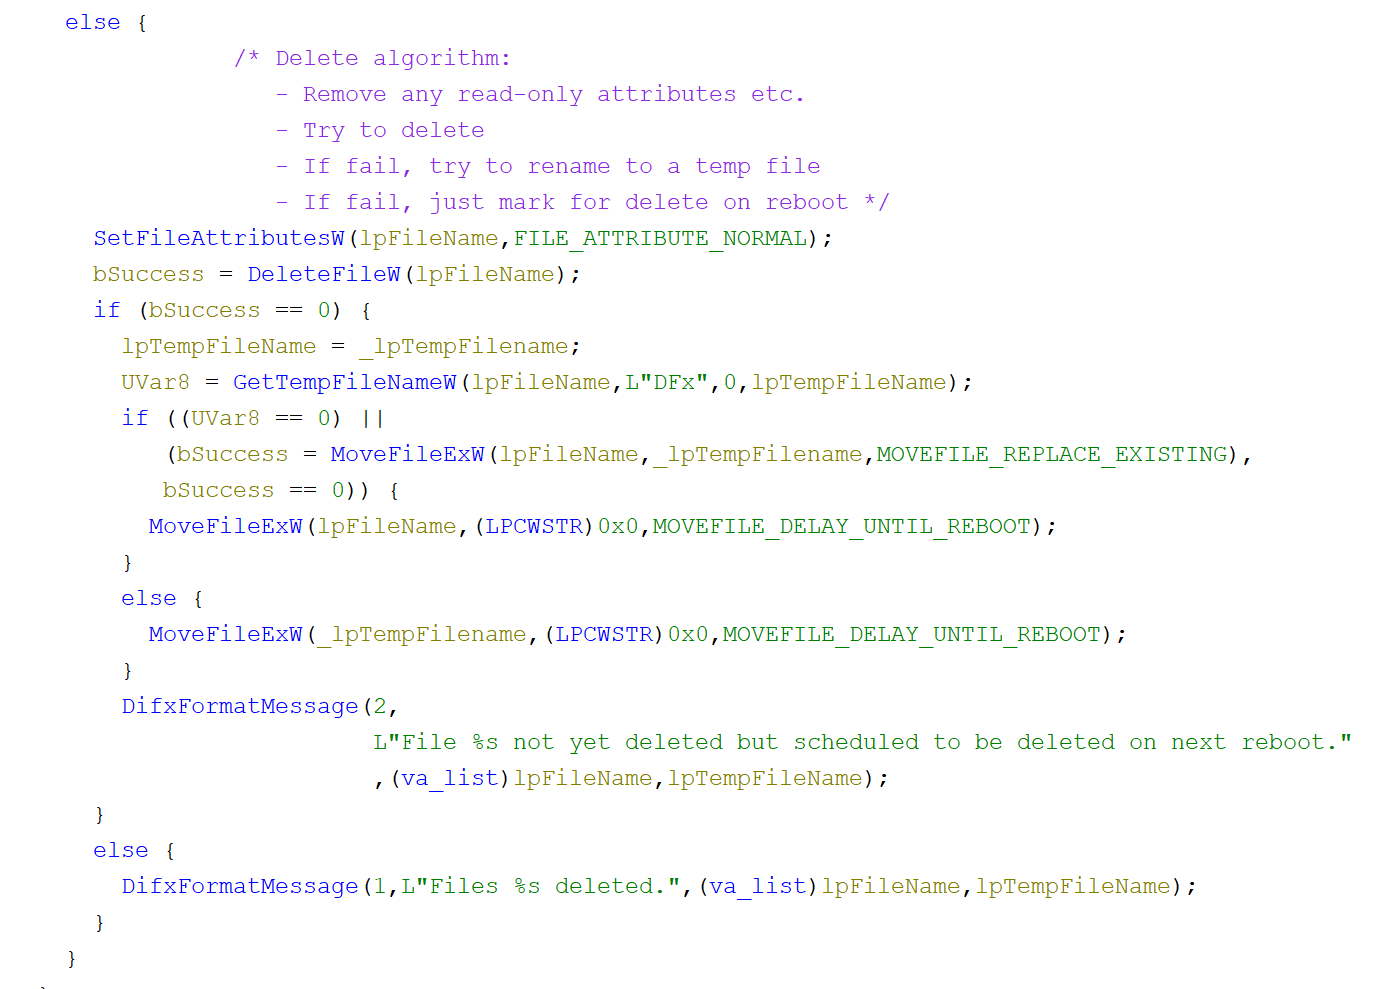
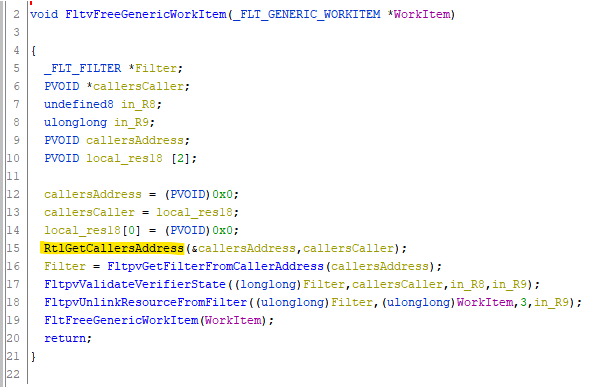
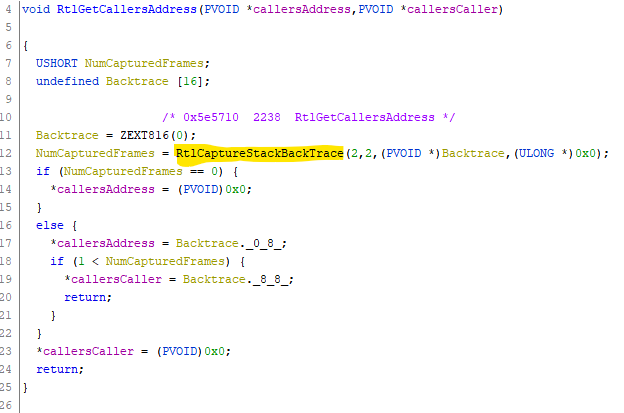
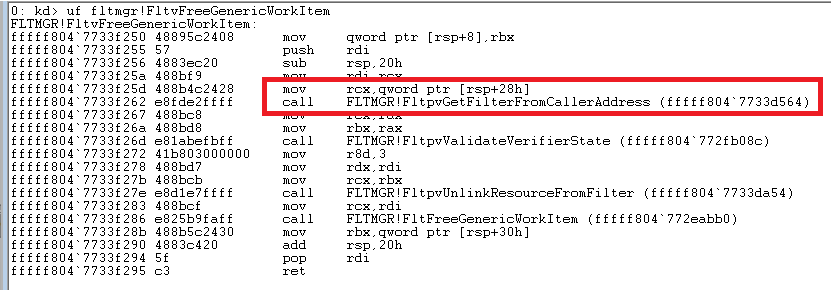
I didn’t feel much satisfaction in figuring this out, perhaps because the LLM did most of the typing. I just wanted to keep going and pin down the reason for the leak in wcifs. So, I got Ghidra up and running, installed GhidraMCP and asked Claude to help me figure out why the handles were leaking. Most of a 4 hour train ride later, it still didn’t have anything convincing to report, though it does seem to be pretty good at converting assembly code into C.

I’ll report this to Microsoft and update the post with their response

Claude’s Script

For completeness, here’s the script. WordPress won’t let me upload it as a file.

#!/usr/bin/env python3
"""
handle_watch.py — Print Windows handle counts every 10 seconds.

Default: monitor SYSTEM (PID 4).
Optional: --total to print total system handles instead.
"""

import argparse
import os
import subprocess
import sys
import time
from datetime import datetime

try:
    import psutil  # pip install psutil
except ImportError:
    print("This script requires 'psutil'. Install with: pip install psutil", file=sys.stderr)
    sys.exit(1)

try:
    from colorama import init, Fore, Style
    init()  # Initialize colorama for Windows color support
    COLOR_AVAILABLE = True
except ImportError:
    print("This script will display color if you have 'colorama'. Install with: pip install colorama", file=sys.stderr)
    COLOR_AVAILABLE = False


def get_handles_for_pid(pid: int) -> int:
    """Return handle count for a specific PID (Windows only)."""
    try:
        p = psutil.Process(pid)
        return p.num_handles()  # Windows-only attribute
    except psutil.NoSuchProcess:
        raise RuntimeError(f"Process with PID {pid} not found.")
    except psutil.AccessDenied:
        raise RuntimeError(f"Access denied retrieving handles for PID {pid}. Try running as Administrator.")


def get_total_handles() -> int:
    """Return total handle count across all processes (Windows only)."""
    total = 0
    for p in psutil.process_iter(attrs=[]):
        try:
            total += p.num_handles()
        except (psutil.NoSuchProcess, psutil.AccessDenied):
            # Skip processes that vanished or are protected
            continue
    return total


def start_wpr_trace():
    """Start WPR trace with specified profiles."""
    cmd = [
        "Wpr.exe",
        "-start", "Handle",
        "-filemode"
    ]
    try:
        subprocess.run(cmd, check=True, capture_output=True, text=True)
        print(f"{datetime.now().strftime('%Y-%m-%d %H:%M:%S')}  WPR trace started")
        return True
    except subprocess.CalledProcessError as e:
        print(f"{datetime.now().strftime('%Y-%m-%d %H:%M:%S')}  Failed to start WPR trace: {e}", file=sys.stderr)
        return False


def stop_wpr_trace():
    """Stop WPR trace and save to c:\\traces folder."""
    # Create traces folder if it doesn't exist
    traces_dir = r"c:\traces"
    os.makedirs(traces_dir, exist_ok=True)
    
    # Generate filename with timestamp
    timestamp = datetime.now().strftime("%Y%m%d_%H%M%S")
    trace_file = os.path.join(traces_dir, f"handle_spike_{timestamp}.etl")
    
    cmd = ["Wpr.exe", "-stop", trace_file]
    try:
        subprocess.run(cmd, check=True, capture_output=True, text=True)
        print(f"{datetime.now().strftime('%Y-%m-%d %H:%M:%S')}  WPR trace saved to {trace_file}")
        return True
    except subprocess.CalledProcessError as e:
        print(f"{datetime.now().strftime('%Y-%m-%d %H:%M:%S')}  Failed to stop WPR trace: {e}", file=sys.stderr)
        return False


def main():
    if os.name != "nt":
        print("This script only works on Windows (requires num_handles).", file=sys.stderr)
        sys.exit(1)

    parser = argparse.ArgumentParser(description="Print Windows handle counts every 10 seconds.")
    group = parser.add_mutually_exclusive_group()
    group.add_argument("--pid", type=int, default=4, help="PID to monitor (default: 4 for SYSTEM).")
    group.add_argument("--total", action="store_true", help="Show total system handle count.")
    parser.add_argument("--interval", type=float, default=30.0, help="Polling interval in seconds (default: 30).")
    parser.add_argument("--handle-threshold", type=int, default=1000, help="Handle count increase threshold to trigger WPR trace (default: 1000).")
    parser.add_argument("--cooldown", type=int, default=3600, help="Cooldown period in seconds before allowing another trace (default: 3600 = 1 hour).")
    parser.add_argument("--trace-duration", type=int, default=60, help="Duration in seconds to run WPR trace (default: 60).")
    args = parser.parse_args()

    mode = "total" if args.total else f"pid={args.pid}"
    print(f"Monitoring handles ({mode}), interval={args.interval}s. Press Ctrl+C to stop.")
    print(f"WPR trace settings: handle-threshold={args.handle_threshold}, cooldown={args.cooldown}s, duration={args.trace_duration}s")

    prev_count = None
    last_trace_time = 0  # Timestamp of last trace start
    trace_active = False
    trace_start_time = 0

    try:
        while True:
            try:
                if args.total:
                    count = get_total_handles()
                else:
                    count = get_handles_for_pid(args.pid)
                ts = datetime.now().strftime("%Y-%m-%d %H:%M:%S")
                
                # Calculate delta
                if prev_count is not None:
                    delta = count - prev_count
                    if COLOR_AVAILABLE:
                        if delta > 0:
                            # Check if delta exceeds threshold - emphasize with bold + bright
                            if delta > args.handle_threshold:
                                delta_str = f"  delta={Fore.RED}{Style.BRIGHT}{delta:+d}{Style.RESET_ALL}"
                            else:
                                delta_str = f"  delta={Fore.RED}{delta:+d}{Style.RESET_ALL}"
                        elif delta < 0:
                            delta_str = f"  delta={Fore.GREEN}{delta:+d}{Style.RESET_ALL}"
                        else:
                            delta_str = f"  delta={delta:+d}"
                    else:
                        delta_str = f"  delta={delta:+d}"
                else:
                    delta_str = ""
                
                print(f"{ts}  handles={count}{delta_str}")
                
                # Check for handle count spike
                if prev_count is not None:
                    current_time = time.time()
                    
                    # If delta > threshold and we're past the cooldown period
                    if delta > args.handle_threshold:
                        time_since_last_trace = current_time - last_trace_time
                        if time_since_last_trace >= args.cooldown and not trace_active:
                            print(f"{ts}  Handle count increased by {delta} (threshold: {args.handle_threshold})")
                            if start_wpr_trace():
                                trace_active = True
                                trace_start_time = current_time
                                last_trace_time = current_time
                
                # Check if we need to stop an active trace
                if trace_active and (time.time() - trace_start_time >= args.trace_duration):
                    stop_wpr_trace()
                    trace_active = False
                
                prev_count = count
                
            except RuntimeError as e:
                # Print the error but keep looping
                ts = datetime.now().strftime("%Y-%m-%d %H:%M:%S")
                print(f"{ts}  error: {e}", file=sys.stderr)

            time.sleep(args.interval)
    except KeyboardInterrupt:
        # Stop trace if active when interrupted
        if trace_active:
            print("\nStopping active trace...")
            stop_wpr_trace()
        print("\nStopped.")


if __name__ == "__main__":
    main()
Posted in Debugging, Kernel, Leak, Process Monitor, Sysinternals Tools | Tagged , , , , | Leave a comment

Doing the Microsoft Word Save Dance

This is a level setting post on the complexities of saving a file. When working at the kernel level, this becomes a serious consideration.

Update (Jan 2026) — Microsoft must get a lot of questions about this. They have a technical note on all the temporary files that Word creates.

Consider an application that encrypts all document files before the data hits the disk. A naive implementation might be to simply check the extension of the file being opened for write. If the extension is .txt, .doc, .docx, etc. setup the file for encryption. Otherwise, ignore the file.

You test your theory using some simple text editor, like the current version of Notepad. Everything works great! Proof of concept complete. Let’s ship it! (this modern version of Notepad is a rewrite — the old notepad was a rite of passage in itself, using memory mapped IO to write files).

Later, an enterprising QA engineer decides to test with Microsoft Word. How different can the save pattern be? Very different.

  1. The Word .docx format is significantly more complicated, as it is a zip file with a different extension.
  2. It takes hundreds of I/O operations to save a Word file, including WRITEs as well as READs.
  3. Word saves the data to a temporary file.
  4. The original file is renamed and the newly saved temporary file is renamed to the original filename.

    In a visual form, here’s Word opening the temporary file and starting to write to it.

Later we even see it reading from the temporary file, then it finishes writing and sets the EOF (end-of-file information)

Finally, once Word is satisfied with the saved file, it renames the original file and renames the temporary file into place. Notice all the additional actions being performed—setting basic attributes, security, object IDs, etc. It’s a big operation to do things this way.

At the end of the whole thing, the directory contains 3 files:

  • test.docx : the newly saved file
  • ~WRL0003.tmp : the original file, before the save
  • ~$test.docx : not sure

Just saving the file incurred over 300 IOs! Our sample encryption product just got more difficult.

  • Do we encrypt all .tmp files?
  • Maybe just encrypt tmp files coming from winword.exe?
  • Or do we encrypt the file when we see it being renamed to .docx?
  • Should we end this post with a question?

Posted in Debugging | Tagged , , | Leave a comment

Driver Installation Pitfalls

The most underrated part of client software is the installer. While it’s easy enough to get something up and running using tools like WiX, the real challenge lies in handling edge cases around install / uninstall, repair, upgrade, and rollback on a wide range of systems and configurations.

As your installation base scales up, the bugs start to come out of the woodwork. Even a .1% bug is noticeable once you’ve scaled into millions of endpoints. The pain is especially true for driver installers; I have even seen installer bugs that lead to BSODs.

In this article, I’m not talking about device drivers Rather, my experience is with Windows security products that use drivers to integrate with various subsystems of the operating system e.g. File system minifilters, WFP filters etc. In my career so far, I’ve worked with anti-virus, DLP, application control, and encryption products, all of which need this low-level integration.

The Goal

For almost all drivers I have worked with — excepting class filter drivers — the steps are straightforward.

Install / Repair

  • Copy the driver into the drivers folder
  • Create an SCM service and add a few registry keys
  • Start the driver

One complexity: If anything goes wrong in the above steps, rollback what we’ve done to ensure the system remains in a consistent state. Rollback is dependent on the installer technology in use, and is out-of-scope of this article.

Uninstall

  • Stop the driver
  • Delete the SCM service
  • Delete the file from disk

Furthermore, the steps above are already available in the .inf file required by Microsoft. So then, why is the installer so difficult to get right? I blame the poor Microsoft documentation and advice for a lot of it

DIFx

For a long time, Microsoft recommended installing drivers using the DIFx framework, despite the fact that DIFx treats everything like a device driver. In my case, I’ve inherited a WiX installer that uses the DIFx extension.

There are a few major problems with DIFx, beginning with the fact that it is now deprecated and no longer ships with the WDK.

Starting in Windows 10 version 1607, the Driver Install Frameworks (DIFx) tools (Difxapi.dllDifxapp.dllDifxappa.dll, and DPInst.exe) are deprecated and are no longer included in the WDK.

The new recommendation is to use a standalone driver package, which again, makes no sense for our case. We are installing a product, and not just a single device driver.

Instead [of DIFx], we recommend providing as a standalone driver package that doesn’t require an installer. This self-contained package adds its own settings or configuration that it needs to function correctly. A standalone driver package doesn’t depend on an installer to modify system state that the driver package might require. Standalone driver packages are required to support distributing the driver package through Windows Update and adding the driver package to an offline image

No Rollback on Upgrade

If an upgrade fails, DIFx rollback is worse than non-existent, See here for an example. No driver is installed AND the product cannot be upgraded or uninstalled until a repair is run on the existing installation.

[After a failed upgrade], DIFxApp should have restored the old version of the driver as part of a rollback. Unfortunately, it does not. The resulting state of the
DIFx portion of the computer is as if an uninstall had been performed. No DIFxApp keys exist in the registry for the old driver, even though the old version of the product is still installed. The old driver is not in the [local] driver store, either.

This results in a frustrating experience for the user when they try to uninstall. The MsiUninstallDrivers requires the presence of DIFxApp registry keys for the component in the registry and when it does not find these, it results in an error and a failed uninstall. Also, because the system is in an incomplete state, the user isn’t able to use the hardware device either, since the driver was uninstalled and never restored as part of the rollback.

Rename / Delete on Reboot

This behavior is even more insidious — it can lead to BSODs at some undetermined point in the future.

During uninstallation, if DIFx can’t delete the driver, it will use MoveFileEx with the MOVEFILE_DELAY_UNTIL_REBOOT flag to mark the driver for delete.

DIFXAPP: INFO:   Looking for file C:\Windows\system32\DRIVERS\Contoso.sys for deletion...
DIFXAPP: WARNING:File C:\Windows\system32\DRIVERS\Contoso.sys not yet deleted but scheduled to be deleted on next reboot.
<snip>
DIFXAPP: A reboot is not needed to uninstall the driver package '{8D3AED50-7EF2-4FE5-99D6-C755B9BB289C}'.

Why is this bad? If this is a transient failure, someone could successfully re-install the program and reboot. During the reboot, the newly installed file will be deleted. This could be after the driver starts, depending on its start type. In any case, the driver is gone from disk. On the next reboot, we either have no running driver, or worse, we get a BSOD. Again, this depends on the start type of the driver. Guess how happy customers are when your installer causes a BSOD two reboots later? And yes, self-protection can mitigate this disaster, but really? We need self-protection to protect us from our own installer???

Similarly, if the driver cannot be installed, DIFx will create a temporary file and schedule a rename for the next boot via MoveFileEx / MOVEFILE_DELAY_UNTIL_REBOOT . This is a bit of foreshadowing — it actually calls Setup API to do the work and then checks the results.

DIFXAPP: INFO:   Installing INF file "C:\Windows\system32\DRVSTORE\Contoso_1078A7F1BA8D78256C90AFCB29DE9BEB957FA03D\Contoso.inf" of Type 4.
DIFXAPP: INFO:   Installing File System Driver 'C:\Windows\system32\DRVSTORE\Contoso_1078A7F1BA8D78256C90AFCB29DE9BEB957FA03D\Contoso.inf'
DIFXAPP: INFO:   'C:\Windows\system32\DRVSTORE\Contoso_1078A7F1BA8D78256C90AFCB29DE9BEB957FA03D\Contoso.inf' requires a reboot.

Driver Store

DIFx always adds the driver to the driver store on install and removes it on uninstall. This is an unnecessary step for non-device drivers and sometimes fails. As we saw earlier, if the driver is not in the driver store during uninstall, DIFx dies a horrible death.

DIFXAPP: ERROR 0x2 encountered while opening persistent-info key for component '{8D3AED50-7EF2-4FE5-99D6-C755B9BB289C}'
DIFXAPP: UninstallDriverPackages failed with error 0x2
DIFXAPP: RETURN: UninstallDriverPackages() 2 (0x2)

Even on success, this sometimes requires a reboot.

DIFXAPP: INFO: The component Id '{8D3AED50-7EF2-4FE5-99D6-C755B9BB289C}' already corresponds to a different driver store called 'C:\Windows\system32\DRVSTORE\Contoso_6166154970FD99AB943A5CCD124D5DDE698FF6EA\Contoso.inf'
DIFXAPP: INFO: The component Id '{8D3AED50-7EF2-4FE5-99D6-C755B9BB289C}' is now set to point to driver store: 'C:\Windows\system32\DRVSTORE\Contoso_4D5E5B63FDADB2B490A58FDC5910849268AE7C06\Contoso.inf'
<snip>
DIFXAPP: INFO: A reboot is needed to install the component '{8D3AED50-7EF2-4FE5-99D6-C755B9BB289C}'.

Setup API

As we saw, DIFx does use standard Setup API functions in some cases. We can work around some of DIFx’s deficiencies by doing the same. Keep in mind that some of the failures with DIFx come from the Setup API itself. (By the way, I was surprised to see that setupapi.dll is almost 5MB on my system — I bet it’s got some good horror stories lurking in there.)

From easiest to hardest, here’s how we accomplish what we need:

Starting and Stopping the Driver

It’s super easy to start the driver once it is installed – no Setup API required. If it’s a minifilter we can call FilterLoad / FilterUnload. Otherwise, we can just call the regular ol’ SCM functions to start and stop a service.

If the service has PPL protections, there’s an additional custom step of disabling PPL protection before stopping / deleting the service.

Installing and Uninstalling the Driver Service

This is also not so bad. We can use the SetupInstallServicesFromInfSectionW function to install / uninstall the service, after opening the inf file via SetupOpenInfFileW . It’s a simple function without too many parameters, and it seems to just work. When it doesn’t work, it appears to give us reasonable return codes.

(3768,1) 09:59:57.171: InfManager: Error installing service section DefaultInstall.ntamd64.Services: 1072

0x430 (WIN32: 1072 ERROR_SERVICE_MARKED_FOR_DELETE) -- 1072 (1072)
Error message text: The specified service has been marked for deletion.

Copying the Driver

SetupInstallFromInfSectionW

Of course, before the other steps, we need to get the driver into %windir%\system32\drivers. It *seems* that calling SetupInstallFromInfSectionW with SPINST_FILES is the answer.

While the function signature is complicated and takes many parameters, including a callback, it worked well in my simple test cases. However, when things got complicated, it fell over in the same ways as DIFx.

File Exists and is Locked Open

If SetupInstallFromInfSectionW detects that the file already exists and cannot be overwritten, it will silently add the SP_COPY_FORCE_IN_USE, copy the driver to a temp location, and queue up a rename for the next boot. Just for good measure, it returns success, so you have no way of knowing that this even happened (unless you want to parse the PendingFileRenameOperations registry value)! Ugh.

// Here's where we call the SetupInstallFromInfSectionW function:
// flags 0x10 = SPINST_FILES
// copyFlags 0x4 = SP_COPY_NEWER_OR_SAME
(3492,1) 19:24:09.953: InfManager: Running section DefaultInstall.ntamd64 from C:\Program Files\Contoso\Contoso.inf with flags=0x10 and copyFlags=0x4

// We get a callback when the copy start. In the edge case where the destination file is locked open, magically, the copy flags have been augmented! 
// flags 0x204 = SP_COPY_FORCE_IN_USE | SP_COPY_NEWER_OR_SAME
(3492,1) 19:24:09.969: FileCallback: Copying file C:\Program Files\Contoso\Contoso.sys to C:\Windows\system32\DRIVERS\Contoso.sys with flags=0x204

// The operation apparently succeeds, but in reality, the old file is still on disk and the new one is queued for a rename on the next boot, via PendingFileRenameOperations!
(3492,1) 19:24:09.969: FileCallback: Copyfile ended for C:\Program Files\Contoso\Contoso.sys to C:\Windows\system32\DRIVERS\Contoso.sys with flags=0x204. Return code is 0

Deleting a file has similar behavior. It will just silently mark the file for delete on the next reboot, which means that the OS *could* end up deleting a valid driver file, by the time that reboot comes around.

Miscellaneous Oddities

The OS provides a default callback that you can use. But, this callback, SetupDefaultQueueCallbackW,  seems to display UI regardless of how you create its associated context. For example, if the driver already exists on disk and has a higher version, users get a pop-up asking if they want to overwrite the file. Customers shouldn’t be deciding things like this.

Solution: Rolling Your Own Copy / Delete Functions

Overwriting or deleting a file is not rocket science, but you do need to take edge cases into account. Weird edge cases, like:

  • The file may already exist, and may be marked with the read-only attribute. In that case delete will fail.
  • The file may already exist, and may be locked open. In that case, there’s nothing you can do. Do you really want to force a reboot to make things work? Perhaps it’s better to just fail the install.
  • The file may already exist, and its version may be higher. Do you want to copy the file in that case? In the security world, maybe yes, since it could be an attempt to break your product.

Conclusion

I have the utmost respect for installer experts. They have to deal with dark areas of the operating system, suffer through misleading (at best) documentation, and often lack respect from management. Something as simple as copying a file and creating a service becomes a gauntlet of painful surprises. I’m hopeful that we’ve chosen a good path, but the real test will be seeing installs scale up in the field. Fingers crossed.

DIFx File Delete Algorithm

Earlier, I mentioned that DIFx can delete a file that is actually in use. That happens because it tries to be a bit too clever. Here’s what I got out of Ghidra:

Posted in Debugging | Tagged , , , | Leave a comment

Debugging Python for Fame and Blog Posts


Python is Magic?

Coming from a C/C++ Windows background, Python seems magical in how easy it is to get things done. However, this ease this comes at a cost. What do you do when things go wrong in a non-trivial way? In particular, with so much abstraction away from the actual operating system, how do you even know what questions to ask when you hit a problem?

Disclaimer: This post is written from the perspective of a C++ Windows user / kernel developer. I use my usual toolset without much explanation. I’ve tried to provide links where appropriate.

The Problem

I recently inherited a Flask test web server used to simulate a real server. It’s a few hundred lines of code and It exposes a few endpoints, all of which are quite simple. During our Python tests, we launch the Flask server as a separate process and our test application starts hitting it with data.

During the tests, one particular endpoint gets hit with a large number of POST requests. We noticed that every now and then the server would hang while processing one of these post requests. Using Fiddler Classic as a proxy, I could see the request getting forwarded to the Flask server, with no corresponding response. Our test application would eventually time out and move on, but this was triggering test failures.

I tried a bunch of lazy troubleshooting, like Googling it (“Flask hang post request”), asking Chat GPT, Googling it again, etc. The main advice seemed to be: don’t use the default Flask implementation because it is unstable, and so I wrapped Flask inside a WSGI called waitress (after I learned what a WSGI was) and well, my problem… remained.

With so many layers of things happening that it’s hard to formulate the right question. What is actually going wrong here? More information is required.

A Pleasant Surprise

If you have experience debugging on Windows, investigating a Python hang is not particularly onerous.

  1. You can easily install symbols from the Python installer via Advanced Options.

2. You can easily download source for Python, and generally, the source for modules comes along when you install them.

Quick Fix

Once I could reproduce the issue, I took a user mode dump of the hanging Python process. I also intentionally crashed the system to get a look at the kernel. In both cases, I could see a thread hung while waiting on a write operation to complete. There were also a few other threads with similar stacks, waiting on a mutex for their turn to write some data.

0: kd> !process ffffe001d7d1f080
PROCESS ffffe001d7d1f080
    SessionId: 2  Cid: 1290    Peb: 7ff72ee4c000  ParentCid: 125c
    DirBase: 54300000  ObjectTable: ffffc0017d293040  HandleCount: <Data Not Accessible>
    Image: python.exe
...        

THREAD ffffe001d7c27080  Cid 1290.12bc  Teb: 00007ff72ed1a000 Win32Thread: 0000000000000000 WAIT: (Executive) KernelMode Alertable
            ffffe001d861e5e8  NotificationEvent
        IRP List:
            ffffcf805f0aee50: (0006,01a8) Flags: 40060a00  Mdl: 00000000
        Not impersonating
        DeviceMap                 ffffc0017a6ad620
        Owning Process            ffffe001d7d1f080       Image:         python.exe
        Attached Process          N/A            Image:         N/A
        Wait Start TickCount      53443          Ticks: 262 (0:00:00:04.093)
        Context Switch Count      3555           IdealProcessor: 5             
        UserTime                  00:00:00.234
        KernelTime                00:00:00.734
        Win32 Start Address ucrtbase!thread_start<unsigned int (__cdecl*)(void * __ptr64)> (0x00007fffe265f460)
        Stack Init ffffd001715dfc90 Current ffffd001715df590
        Base ffffd001715e0000 Limit ffffd001715da000 Call 0000000000000000
        Priority 10  BasePriority 8  Unusual Boost 2  IoPriority 2  PagePriority 5
 # Child-SP          RetAddr               Call Site
00 ffffd001`715df5d0 fffff801`186b268e     nt!KiSwapContext+0x76
01 ffffd001`715df710 fffff801`186b2109     nt!KiSwapThread+0x14e
02 ffffd001`715df7b0 fffff801`186bb183     nt!KiCommitThreadWait+0x129
03 ffffd001`715df830 fffff801`18af6939     nt!KeWaitForSingleObject+0x373
04 ffffd001`715df8c0 fffff801`18a975d4     nt!IopSynchronousServiceTail+0x3cd
05 ffffd001`715df990 fffff801`187cfd13     nt!NtWriteFile+0x694
06 ffffd001`715dfa90 00007fff`ebbd005a     nt!KiSystemServiceCopyEnd+0x13
07 00000091`6261e228 00007fff`e9051c5c     ntdll!NtWriteFile+0xa
08 00000091`6261e230 00007fff`e26549ae     KERNELBASE!WriteFile+0x8c
09 00000091`6261e2b0 00007fff`e26547f9     ucrtbase!write_binary_nolock+0x52
0a 00000091`6261e2f0 00007fff`e26546fd     ucrtbase!_write_nolock+0xb5
0b 00000091`6261e350 00007fff`c29667d0     ucrtbase!_write+0x8d
0c 00000091`6261e3a0 00007fff`c2966636     python312!_Py_write_impl+0x98
0d (Inline Function) --------`--------     python312!_Py_write+0x14
0e 00000091`6261e400 00007fff`c29665cc     python312!_io_FileIO_write_impl+0x32
0f 00000091`6261e430 00007fff`c291601d     python312!_io_FileIO_write+0xa0
10 00000091`6261e4e0 00007fff`c2906ea7     python312!method_vectorcall_FASTCALL_KEYWORDS_METHOD+0xa1
11 (Inline Function) --------`--------     python312!_PyObject_VectorcallTstate+0x2c
12 00000091`6261e540 00007fff`c292ef65     python312!PyObject_VectorcallMethod+0xab
13 (Inline Function) --------`--------     python312!PyObject_CallMethodOneArg+0x2f
14 00000091`6261e590 00007fff`c29307a8     python312!_bufferedwriter_raw_write+0x99
15 00000091`6261e640 00007fff`c292d737     python312!_bufferedwriter_flush_unlocked+0x7c
16 00000091`6261e670 00007fff`c292d560     python312!_io_BufferedWriter_write_impl+0x1ab
17 00000091`6261e6b0 00007fff`c2907e35     python312!_io_BufferedWriter_write+0x64
18 00000091`6261e730 00007fff`c2906ea7     python312!method_vectorcall_O+0xd9
19 (Inline Function) --------`--------     python312!_PyObject_VectorcallTstate+0x2c
1a 00000091`6261e770 00007fff`c28bb90c     python312!PyObject_VectorcallMethod+0xab
1b (Inline Function) --------`--------     python312!PyObject_CallMethodOneArg+0x2c
1c 00000091`6261e7c0 00007fff`c2a30ff7     python312!_textiowrapper_writeflush+0x138
1d 00000091`6261e820 00007fff`c28bac21     python312!_io_TextIOWrapper_write_impl+0x1763ab
1e 00000091`6261e890 00007fff`c2899e59     python312!_io_TextIOWrapper_write+0x1d
1f 00000091`6261e8c0 00007fff`c289ef8f     python312!cfunction_vectorcall_O+0x89
20 00000091`6261e900 00007fff`c291398f     python312!_PyObject_VectorcallTstate+0x8f
21 00000091`6261e980 00007fff`c28b26ed     python312!PyObject_CallOneArg+0x43
22 00000091`6261e9d0 00007fff`c28b25b7     python312!PyFile_WriteObject+0x61
23 00000091`6261ea00 00007fff`c28b2f72     python312!builtin_print_impl+0xab
24 00000091`6261ea50 00007fff`c28a348f     python312!builtin_print+0xba
25 00000091`6261eb10 00007fff`c289e55c     python312!_PyEval_EvalFrameDefault+0x36ff
26 (Inline Function) --------`--------     python312!_PyEval_EvalFrame+0x18
27 (Inline Function) --------`--------     python312!_PyEval_Vector+0x12a
28 00000091`6261ed90 00007fff`c28d59db     python312!_PyFunction_Vectorcall+0x17c
29 00000091`6261edf0 00007fff`c28d41db     python312!_PyObject_FastCallDictTstate+0x73
2a 00000091`6261ee40 00007fff`c28d4106     python312!_PyObject_Call_Prepend+0x7f
2b 00000091`6261eee0 00007fff`c289f658     python312!slot_tp_call+0x72
2c (Inline Function) --------`--------     python312!_PyObject_MakeTpCall+0x54f
2d 00000091`6261ef30 00007fff`c289eef5     python312!_PyObject_VectorcallTstate+0x758
2e 00000091`6261efb0 00007fff`c28a0609     python312!PyObject_Vectorcall+0x35
2f 00000091`6261eff0 00007fff`c289e55c     python312!_PyEval_EvalFrameDefault+0x879
30 (Inline Function) --------`--------     python312!_PyEval_EvalFrame+0x18
31 (Inline Function) --------`--------     python312!_PyEval_Vector+0x12a
32 00000091`6261f270 00007fff`c289900e     python312!_PyFunction_Vectorcall+0x17c
33 (Inline Function) --------`--------     python312!_PyObject_VectorcallTstate+0x37
34 00000091`6261f2d0 00007fff`c2938731     python312!method_vectorcall+0xde
35 00000091`6261f390 00007fff`c293867b     python312!_PyVectorcall_Call+0x49
36 (Inline Function) --------`--------     python312!_PyObject_Call+0x44
37 00000091`6261f3d0 00007fff`c28a47c0     python312!PyObject_Call+0x6f
38 00000091`6261f420 00007fff`c289e55c     python312!_PyEval_EvalFrameDefault+0x4a30
39 (Inline Function) --------`--------     python312!_PyEval_EvalFrame+0x18
3a (Inline Function) --------`--------     python312!_PyEval_Vector+0x12a
3b 00000091`6261f6a0 00007fff`c28990f3     python312!_PyFunction_Vectorcall+0x17c
3c (Inline Function) --------`--------     python312!_PyObject_VectorcallTstate+0x37
3d 00000091`6261f700 00007fff`c2938731     python312!method_vectorcall+0x1c3
3e 00000091`6261f7c0 00007fff`c293867b     python312!_PyVectorcall_Call+0x49
3f (Inline Function) --------`--------     python312!_PyObject_Call+0x44
40 00000091`6261f800 00007fff`c28ed600     python312!PyObject_Call+0x6f
41 00000091`6261f850 00007fff`c28ed5a6     python312!thread_run+0x48
42 00000091`6261f880 00007fff`e265f4a0     python312!bootstrap+0x32
43 00000091`6261f8b0 00007fff`eb1e13f2     ucrtbase!thread_start<unsigned int (__cdecl*)(void * __ptr64)>+0x40
44 00000091`6261f8e0 00007fff`ebb55504     KERNEL32!BaseThreadInitThunk+0x22
45 00000091`6261f910 00000000`00000000     ntdll!RtlUserThreadStart+0x34

We don’t have to look at all the frames in the stack; it’s easy enough to see that the thread is hanging in a call to builtin_print. This sounds like a function that might implement the print() function in Python, and indeed after replacing all the print() statements in my Flask server with logging, the hang went away!

Quick fix, but unsatisfying. Writing a comment like: "# WARNING: Do not use print() in this file because it causes a hang for some unknown reason" is never fun.

Digging In

The hanging thread is waiting for a write operation to complete. In Windows, IO is handled via IO Request Packets (IRPs ), and we can see the IRP address near the top of the thread output.

Mex helps us get a bit further, providing the address of the pipe and, critically, the owner of the pipe. Unfortunately, I missed this on my initial analysis. It shows the owner as python.exe, which I initially mistook for the hanging python process.

I took an extra step and ran the !search command, which finally clued me in to the real owner of the pipe – our original Python process that runs all the tests! In other words, the parent of the hanging process.

0: kd> !mex.mirp ffffcf805f0aee50

Irp Details: ffffcf805f0aee50 [ verbose | !ddt | !irp ]

    Thread                       Frame Count
    ============================ ===========
    ffffe001d7c27080(python.exe)           2

Irp Stack Frame(s)

      # Driver           Major Minor Dispatch Routine      Flg Ctrl Status  Device           File             Args                                               
    === ================ ===== ===== ===================== === ==== ======= ================ ================ ===================================================================
    ->2 \FileSystem\Npfs WRITE     0 error
Npfs!NpFsdWrite   0    1 Pending ffffe001d57c31e0 ffffe001d861e550 0000000000001fdb 0000000000000000 0000000000000000 0000000000000000

File Details: ffffe001d861e550

    Name Device           Driver              Vpb Flags Byte Offset              FsContext             FsContext2 Owning Process
    ==== ================ ================ ====== ===== =========== ====================== ====================== ==============
         ffffe001d57c31e0 \FileSystem\Npfs (null) 40082           0 ffffc0016dba0010(NpfF) ffffc0017d24f5a1(NpFc) python.exe
0: kd> !search ffffe001d861e550
Searching PFNs in range 0000000000000001 - 0000000000107FFF for [FFFFE001D861E550 - FFFFE001D861E550]

Pfn              Offset   Hit              Va               Pte              
- - - - - - - - - - - - - - - - - - - - - - - - - - - - - - - - - - - - - - - - - - - - - - - - -
...
0000000000051E33 000005D0 FFFFE001D861E550 FFFFC0017D24F5D0 FFFFF6E000BE9278 
	ffffc0017d24f590+0x40    : NpFc  -- CCB, client control block - Process: ffffe001d87cd240
...

0: kd> !process ffffe001d87cd240
PROCESS ffffe001d87cd240
    SessionId: 2  Cid: 125c    Peb: 7ff72ec98000  ParentCid: 1160
    DirBase: 1fb00000  ObjectTable: ffffc00170867e00  HandleCount: <Data Not Accessible>
    Image: python.exe

Root Cause

I eventually remembered that on Windows, one way to start a process and capture its output is to use anonymous pipes. But, these pipes have a maximum buffer size. If nobody is reading data from the pipe, at some point it will fill up and any writes to the pipe will hang until there is room for more data.

Our code uses plumbum’s local[cmd].popen() to create the Flask server in a new process. Taking a look at the plumbum source shows exactly how this happens. Under the covers, stdin, stdout, and stderr are all hardcoded to use pipes.

    def popen(self, args=(), cwd=None, env=None, **kwargs):
        if isinstance(args, str):
            args = (args,)
        return self.machine._popen(
            self.executable,
            self.formulate(0, args),
            cwd=self.cwd if cwd is None else cwd,
            env=self.env if env is None else env,
            **kwargs,
        )

    ...

    def _popen(
        self,
        executable,
        argv,
        stdin=PIPE,
        stdout=PIPE,
        stderr=PIPE,
        cwd=None,
        env=None,
        new_session=False,
        **kwargs,
    ):
...

The real fix here is to use something like subprocess.popen() instead, so you more flexibility about where stdout goes.

Python is not Magic!

Any sufficiently advanced technology is indistinguishable from magic
– Arthur C. Clarke

It’s relieving that Python makes it fairly easy to see what’s going on, via debug symbols and source code. It makes me like the language more.

Addendum

I left out a bit of the story. When using waitress as the WSGI, all requests ground to a halt soon after the pipe hang. But, when using the default Flask implementation, the server seemed to recover and continue onwards. This was another sleight-of-hand.

The default Flask server is said to be single-threaded, but this is not actually the case. From profiling in the debugger, I can see a new thread being spun up for each incoming request. Maybe there’s an upper limit here, but we never hit it.

Waitress, on the other hand, spins up the requested number of serving threads (4 by default) and does not allow any more. Once the first thread hangs, the remaining threads soon end up waiting on the write mutex and no work can be done.

And — the other critical bit – not every call to print() results in a write to the pipe; only calls that require flushing do. This happens periodically in a way that I’m not interested in delving into.

For completeness, here’s an example of one of the threads waiting on the write mutex.

        THREAD ffffe001d6f2c080  Cid 1290.12b8  Teb: 00007ff72ed1c000 Win32Thread: 0000000000000000 WAIT: (UserRequest) UserMode Non-Alertable
            ffffe001d87c3520  Semaphore Limit 0x186a0
        Not impersonating
        DeviceMap                 ffffc0017a6ad620
        Owning Process            ffffe001d7d1f080       Image:         python.exe
        Attached Process          N/A            Image:         N/A
        Wait Start TickCount      53523          Ticks: 182 (0:00:00:02.843)
        Context Switch Count      5342           IdealProcessor: 3             
        UserTime                  00:00:00.234
        KernelTime                00:00:00.890
        Win32 Start Address ucrtbase!thread_start<unsigned int (__cdecl*)(void * __ptr64)> (0x00007fffe265f460)
        Stack Init ffffd001715b4c90 Current ffffd001715b4760
        Base ffffd001715b5000 Limit ffffd001715af000 Call 0000000000000000
        Priority 9  BasePriority 8  Unusual Boost 1  IoPriority 2  PagePriority 5
 # Child-SP          RetAddr               Call Site
00 ffffd001`715b47a0 fffff801`186b268e     nt!KiSwapContext+0x76
01 ffffd001`715b48e0 fffff801`186b2109     nt!KiSwapThread+0x14e
02 ffffd001`715b4980 fffff801`186bb183     nt!KiCommitThreadWait+0x129
03 ffffd001`715b4a00 fffff801`18a3afa2     nt!KeWaitForSingleObject+0x373
04 ffffd001`715b4a90 fffff801`187cfd13     nt!NtWaitForSingleObject+0xb2
05 ffffd001`715b4b00 00007fff`ebbd001a     nt!KiSystemServiceCopyEnd+0x13
06 00000091`6242e4c8 00007fff`e9051118     ntdll!NtWaitForSingleObject+0xa
07 00000091`6242e4d0 00007fff`c29f1362     KERNELBASE!WaitForSingleObjectEx+0x98
08 00000091`6242e570 00007fff`c28d27f0     python312!_PyCOND_WAIT_MS+0x32
09 (Inline Function) --------`--------     python312!PyCOND_WAIT+0x10
0a 00000091`6242e5a0 00007fff`c28d2765     python312!EnterNonRecursiveMutex+0x70
0b 00000091`6242e5e0 00007fff`c2aa3c41     python312!PyThread_acquire_lock_timed+0x51
0c 00000091`6242e610 00007fff`c2a49274     python312!_enter_buffered_busy+0x89
0d 00000091`6242e640 00007fff`c292d560     python312!_io_BufferedWriter_write_impl+0x11bce8
0e 00000091`6242e680 00007fff`c2907e35     python312!_io_BufferedWriter_write+0x64
0f 00000091`6242e700 00007fff`c2906ea7     python312!method_vectorcall_O+0xd9
10 (Inline Function) --------`--------     python312!_PyObject_VectorcallTstate+0x2c
11 00000091`6242e740 00007fff`c28bb90c     python312!PyObject_VectorcallMethod+0xab
12 (Inline Function) --------`--------     python312!PyObject_CallMethodOneArg+0x2c
13 00000091`6242e790 00007fff`c2a30ff7     python312!_textiowrapper_writeflush+0x138
14 00000091`6242e7f0 00007fff`c28bac21     python312!_io_TextIOWrapper_write_impl+0x1763ab
15 00000091`6242e860 00007fff`c2899e59     python312!_io_TextIOWrapper_write+0x1d
16 00000091`6242e890 00007fff`c289ef8f     python312!cfunction_vectorcall_O+0x89
17 00000091`6242e8d0 00007fff`c291398f     python312!_PyObject_VectorcallTstate+0x8f
18 00000091`6242e950 00007fff`c28b26ed     python312!PyObject_CallOneArg+0x43
19 00000091`6242e9a0 00007fff`c28b25b7     python312!PyFile_WriteObject+0x61
1a 00000091`6242e9d0 00007fff`c28b2f72     python312!builtin_print_impl+0xab
1b 00000091`6242ea20 00007fff`c28a348f     python312!builtin_print+0xba
1c 00000091`6242eae0 00007fff`c289e55c     python312!_PyEval_EvalFrameDefault+0x36ff
1d (Inline Function) --------`--------     python312!_PyEval_EvalFrame+0x18
1e (Inline Function) --------`--------     python312!_PyEval_Vector+0x12a
1f 00000091`6242ed60 00007fff`c28d59db     python312!_PyFunction_Vectorcall+0x17c
20 00000091`6242edc0 00007fff`c28d41db     python312!_PyObject_FastCallDictTstate+0x73
21 00000091`6242ee10 00007fff`c28d4106     python312!_PyObject_Call_Prepend+0x7f
22 00000091`6242eeb0 00007fff`c289f658     python312!slot_tp_call+0x72
23 (Inline Function) --------`--------     python312!_PyObject_MakeTpCall+0x54f
24 00000091`6242ef00 00007fff`c289eef5     python312!_PyObject_VectorcallTstate+0x758
25 00000091`6242ef80 00007fff`c28a0609     python312!PyObject_Vectorcall+0x35
26 00000091`6242efc0 00007fff`c289e55c     python312!_PyEval_EvalFrameDefault+0x879
27 (Inline Function) --------`--------     python312!_PyEval_EvalFrame+0x18
28 (Inline Function) --------`--------     python312!_PyEval_Vector+0x12a
29 00000091`6242f240 00007fff`c289900e     python312!_PyFunction_Vectorcall+0x17c
2a (Inline Function) --------`--------     python312!_PyObject_VectorcallTstate+0x37
2b 00000091`6242f2a0 00007fff`c2938731     python312!method_vectorcall+0xde
2c 00000091`6242f360 00007fff`c293867b     python312!_PyVectorcall_Call+0x49
2d (Inline Function) --------`--------     python312!_PyObject_Call+0x44
2e 00000091`6242f3a0 00007fff`c28a47c0     python312!PyObject_Call+0x6f
2f 00000091`6242f3f0 00007fff`c289e55c     python312!_PyEval_EvalFrameDefault+0x4a30
30 (Inline Function) --------`--------     python312!_PyEval_EvalFrame+0x18
31 (Inline Function) --------`--------     python312!_PyEval_Vector+0x12a
32 00000091`6242f670 00007fff`c28990f3     python312!_PyFunction_Vectorcall+0x17c
33 (Inline Function) --------`--------     python312!_PyObject_VectorcallTstate+0x37
34 00000091`6242f6d0 00007fff`c2938731     python312!method_vectorcall+0x1c3
35 00000091`6242f790 00007fff`c293867b     python312!_PyVectorcall_Call+0x49
36 (Inline Function) --------`--------     python312!_PyObject_Call+0x44
37 00000091`6242f7d0 00007fff`c28ed600     python312!PyObject_Call+0x6f
38 00000091`6242f820 00007fff`c28ed5a6     python312!thread_run+0x48
39 00000091`6242f850 00007fff`e265f4a0     python312!bootstrap+0x32
3a 00000091`6242f880 00007fff`eb1e13f2     ucrtbase!thread_start<unsigned int (__cdecl*)(void * __ptr64)>+0x40
3b 00000091`6242f8b0 00007fff`ebb55504     KERNEL32!BaseThreadInitThunk+0x22
3c 00000091`6242f8e0 00000000`00000000     ntdll!RtlUserThreadStart+0x34
Posted in Debugging | Leave a comment

Windbg Cookbook: Attach to a PPL Process from UM

Debugging PPL processes is quite possible even without attaching a kernel debugger. My favorite post on the subject is here.

This is just a quick recipe for cases where you have a kernel debugger attached and you want to debug your PPL process with a user mode debugger. For example, WOW64 processes are a lot easier to debug by attaching a 32-bit debugger in user mode.

Note: You can use any debugger for the kernel debugger, but you *must* use WinDBG classic as the user mode debugger. The Windows Store version launches extra processes while attaching, and things go south.

* Start windbg.exe elevated, break into kernel
* Find windbg.exe process
0: kd> !process 0 0 windbg.exe
PROCESS ffffe381778660c0
    SessionId: 1  Cid: 043c    Peb: 04c7b000  ParentCid: 1684
    DirBase: 39d2a002  ObjectTable: ffffa48826ca4580  HandleCount: 213.
    Image: windbg.exe

* Find the Protection offset on this version of Windows
0: kd> dt _EPROCESS Protection
nt!_EPROCESS
   +0x87a Protection : _PS_PROTECTION

* Figure out where the Protection field is stored for windbg.exe
0: kd> ?? 0xffffe381778660c0 + 0x87a
unsigned int64 0xffffe381`7786693a

* Edit to 0x31 (AMPPL), 0x61 (WinTCB) etc...
0: kd> eb  0xffffe381`7786693a
ffffe381`7786693a 00 0x31
ffffe381`7786693b 00 

* Now you can attach your user mode debugger to your PPL process,

Posted in Windbg, Windows | Leave a comment

Creating a process without starting it

I looked at a case today where our process was not starting for some reason. It had one thread and the thread stack looked very much like this:

0: kd> !process ffffa08d5bcc70c0
PROCESS ffffa08d5bcc70c0
    SessionId: 1  Cid: 8cdc    Peb: 1fcb598000  ParentCid: 7bd4
    DirBase: 4225ed002  ObjectTable: ffffb98871b4e840  HandleCount:   0.
    Image: Notepad.exe
    VadRoot ffffa08d68fb3a60 Vads 15 Clone 0 Private 42. Modified 0. Locked 0.
    DeviceMap 0000000000000000
    Token                             ffffb988797ed060
    ElapsedTime                       00:00:55.748
    UserTime                          00:00:00.000
    KernelTime                        00:00:00.000
    QuotaPoolUsage[PagedPool]         10712
    QuotaPoolUsage[NonPagedPool]      2176
    Working Set Sizes (now,min,max)  (719, 50, 345) (2876KB, 200KB, 1380KB)
    PeakWorkingSetSize                697
    VirtualSize                       6 Mb
    PeakVirtualSize                   6 Mb
    PageFaultCount                    719
    MemoryPriority                    BACKGROUND
    BasePriority                      8
    CommitCharge                      116
    Job                               ffffa08d44618540

        THREAD ffffa08d2a4e5080  Cid 8cdc.91ac  Teb: 0000001fcb599000 Win32Thread: 0000000000000000 WAIT: (Suspended) KernelMode Non-Alertable
SuspendCount 1
            ffffa08d2a4e5360  NotificationEvent
        Not impersonating
        Owning Process            ffffa08d5bcc70c0       Image:         Notepad.exe
        Attached Process          N/A            Image:         N/A
        Wait Start TickCount      23344932       Ticks: 3568 (0:00:00:55.750)
        Context Switch Count      1              IdealProcessor: 2             
        UserTime                  00:00:00.000
        KernelTime                00:00:00.000
        Win32 Start Address 0x00007ff685bbb37c
        Stack Init ffffb881dbf57b70 Current ffffb881dbf56db0
        Base ffffb881dbf58000 Limit ffffb881dbf51000 Call 0000000000000000
        Priority 8 BasePriority 8 PriorityDecrement 0 IoPriority 2 PagePriority 5
        Scheduling Group: ffffa08d2b382080
        Child-SP          RetAddr               Call Site
        ffffb881`dbf56df0 fffff801`82c37825     nt!KiSwapContext+0x76
        ffffb881`dbf56f30 fffff801`82c38c47     nt!KiSwapThread+0xb05
        ffffb881`dbf57080 fffff801`82c3b296     nt!KiCommitThreadWait+0x137
        ffffb881`dbf57130 fffff801`82c15c53     nt!KeWaitForSingleObject+0x256
        ffffb881`dbf574d0 fffff801`82c0d2de     nt!KiSchedulerApc+0x233
        ffffb881`dbf575f0 fffff801`82e316dc     nt!KiDeliverApc+0x2ee
        ffffb881`dbf576b0 fffff801`83091e21     nt!KiApcInterrupt+0x35c (TrapFrame @ ffffb881`dbf576b0)
        ffffb881`dbf57840 fffff801`82e30c28     nt!PspUserThreadStartup+0x21
        ffffb881`dbf578a0 fffff801`82e30b90     nt!KiStartUserThread+0x28
        ffffb881`dbf579e0 00007ffb`4694a9d0     nt!KiStartUserThreadReturn (TrapFrame @ ffffb881`dbf579e0)
        0000001f`cb3bfb58 00000000`00000000     ntdll!RtlUserThreadStart


The thread is clearly suspended. My first thought was that someone manually suspended the thread. But on closer inspection, UserTime and KernelTime are both 0, HandleCount is 0, etc…

I ran a quick test, calling CreateProcess with the CREATE_SUSPENDED flag and ended up with what you see above.

CREATE_SUSPENDED – The primary thread of the new process is created in a suspended state, and does not run until the ResumeThread function is called.

I was a little surprised to see that the APC mechanism is used to suspend the thread even before it has started. I’m curious about this, but for now, I’m just going to leave this here for my future self.

Posted in Debugging, Windbg, Windows | Leave a comment

Learning about Rundown References (aka Failing to Track Down a Reference Leak)

I’ve been trying to track down a rare case where our filter driver hangs on unload. I haven’t yet been able to find the source of the leak, but I have learned something about rundown references. Perhaps this will help others in a similar situation.

The hang always ends up with a stack similar to this one:

1: kd> k
*** Stack trace for last set context - .thread/.cxr resets it
# Child-SP RetAddr Call Site
00 ffffd000`365cd2a0 fffff803`c565684e nt!KiSwapContext+0x76
01 ffffd000`365cd3e0 fffff803`c56562c9 nt!KiSwapThread+0x14e
02 ffffd000`365cd480 fffff803`c565f1f3 nt!KiCommitThreadWait+0x129
03 ffffd000`365cd500 fffff803`c5643d55 nt!KeWaitForSingleObject+0x373
04 ffffd000`365cd590 fffff801`6780a196 nt!ExfWaitForRundownProtectionRelease+0xc5
05 ffffd000`365cd600 fffff801`67848e07 fltmgr!FltpWaitForRundownProtectionReleaseInternal+0xd6
06 ffffd000`365cd710 fffff801`67af3b1f fltmgr!FltUnregisterFilter+0x173
07 ffffd000`365cd7b0 fffff801`67b9d761 Contoso!MiniFilter::Stop+0xdf
0c ffffd000`365cd910 fffff801`67849f99 fltmgr!FltpDoUnloadFilter+0xfa
0d ffffd000`365cdb00 fffff803`c566815f fltmgr!FltpSyncOpWorker+0x3d
0e ffffd000`365cdb50 fffff803`c56e07aa nt!ExpWorkerThread+0x69f
0f ffffd000`365cdc00 fffff803`c5755f66 nt!PspSystemThreadStartup+0x18a
10 ffffd000`365cdc60 00000000`00000000 nt!KiStartSystemThread+0x16

The important bit is the call to ExfWaitForRundownProtectionRelease – the OS is waiting for the all references to our _FLT_FILTER object to disappear so that it can safely be cleaned up.

When I looked at the RundownRef reference count, I expected to see an actual refcount. But instead I saw 0xffffd000365cd5c1. That does not look like a reference count. It looks *kind of like a pointer* but it’s weird to see a 1 at the end of a pointer. What gives?

FLT_FILTER: ffffe0013a65b650 "Contoso" "5555555"
FLT_OBJECT: ffffe0013a65b650 [02000001] Filter DRAINING
RundownRef : 0xffffd000365cd5c1
Could not read field "Count" of nt!_EX_RUNDOWN_WAIT_BLOCK from address: ffffd000365cd5c0
PointerCount : 0x00000002
PrimaryLink : [ffffe0013a887820-ffffe0013a821280]
Frame : ffffe0013a669010 "Frame 0"


Searching NTFSD yields similar results & confusion.

Rundown Protection in the Windows Kernel

Reference counted objects get cleaned up when the number of references drops to zero. To get to zero references, you might put the object in a ‘draining’ state. That is to say, any attempt to add a reference fails, but dereferences continue as normal. This is particularly common in kernel, where you often don’t have control over when your code gets called.

The Windows kernel implements such a mechanism via Rundown Protection. You include an _EX_RUNDOWN_REF in your object and then use ExAcquireRundownProtection as your AddRef and ExReleaseRundownProtection as your Deref.

fltmgr!_EX_RUNDOWN_REF
+0x000 Count : Uint8B
+0x000 Ptr : Ptr64 Void

When not draining, the rundown ref will have an actual reference count associated it.

NOTE: The value of Count is 2 times the actual reference count. This is done as a space optimization – the final bit will always be 0 until it’s time to drain.

The simplified pseudocode for ExAcquireRundownProtection looks like this (here’s the ReactOS version):

BOOLEAN
 ExAcquireRundownProtection(IN PEX_RUNDOWN_REF RunRef)
{
  // Is this rundown reference being drained? (Check the last bit)
  if RundownRef.Ptr & 1
    // Yes. We can't addref.
    return FALSE
  else
    // No. Atomically addref
    RundownRef.Count += 2
    return TRUE
}

At some point (say, when you want to unload your minifilter), the rundown ref will be put into a draining state via a call to ExWaitForRundownProtectionRelease. This call does not return until the rundown reference is completely drained.

Internally, an _EX_RUNDOWN_WAIT_BLOCK structure is created on the stack and the rundown ref is modified to point to it. Unfortunately the public symbols for this struct are not available. Here’s the definition from ReactOS:

//
// Executive Rundown Wait Block
//
typedef struct _EX_RUNDOWN_WAIT_BLOCK
{
    ULONG_PTR Count;
    KEVENT WakeEvent;
} EX_RUNDOWN_WAIT_BLOCK, *PEX_RUNDOWN_WAIT_BLOCK;

Here is the simplified pseudocode for ExWaitForRundownProtectionRelease (Here’s the ReactOS version):

VOID ExfWaitForRundownProtectionRelease(IN PEX_RUNDOWN_REF RunRef)
{

  // Ignoring synchronization issues to keep it simple
  EX_RUNDOWN_WAIT_BLOCK RundownBlock;
  KeInitializeEvent(&RundownBlock.WakeEvent, 
    SynchronizationEvent, FALSE)

  // Store the *real* count
  RundownBlock.Count = RunRef->Count / 2

  // Signal that RunRef is draining
  RunRef->Ptr = &RundownBlock | 1
  
  // The last call to ExReleaseRundownProtection
  // will fire this event
  KeWaitForSingleEvent(&RundownBlock.WakeEvent, 
    Executive, KernelMode, False, NULL)
}

Finally, here is the pseudocode for ExReleaseRundownProtection (here’s the ReactOS version):

VOID
ExReleaseRundownProtection(IN PEX_RUNDOWN_REF RunRef)
{

  // Ignoring synchronization issues to keep it simple
  // Is this rundown reference being drained?
  If RundownRef.Ptr & 1
    // Yes -  is now a pointer to the stack of the owner
    // Get rid of the least significant bit to get the actual pointer
    EX_RUNDOWN_WAIT_BLOCK StackPointer = 
      RundownRef.Ptr & 0xfffffffffffffffe

    // Atomically decrement by *1* in this case
    StackPointer->Count -= 1

    if StackPointer->Count == 0
      KeSetEvent(&(StackPointer->WakeEvent))
      return

  else
    // Not being drained. Atomically deref by 2 and return
    RundownRef.Count -= 2
    return
}

Well, back to it. If it’s not productive procrastination, you’re not doing it right.

Posted in Debugging | Leave a comment

Compiler:1, Filter Verifier:0 –OR– Why Your Mother Told You that Stackwalking is Dangerous

Update: I reported this to the Filter Manager team at Microsoft. Of course, they already knew about it but maybe my report tipped the scales, because it is now documented on the Filter Verifier page.


One of our excellent testers recently logged a bug because our driver triggered a BSOD on unload, when Driver Verifier was enabled. After a lot of head scratching, we determined that our driver is fine but a compiler optimization breaks a Filter Verifier check.

With a debugger attached, the verifier output looked like this:

FILTER VERIFIER ERROR: A filter (Filter = FFFFAC04A21CD8A0 (MyDriver)) leaked references to the following resources:
00000000 Filter Context Structures
00000000 FLT_CALLBACK_DATA structures
00000000 FLT_DEFERRED_IO_WORKITEM structures
00000479 FLT_GENERIC_WORKITEM structures
00000000 FLT_FILE_NAME_INFORMATION structures
00000000 FILE_OBJECT structures
00000000 FLT_OBJECT structures
00000000 ECP context structures
Type "!fltkd.filter FFFFAC04A21CD8A0 8 1" in the debugger for a list of leaked
 Break, ignore, zap or remove ?

Other people have had this problem in the past and the advice was: “if you’re not leaking references, just ignore the error.” That is fine on a dev machine but QA generally doesn’t like to ignore BSODs. It’s also a pain in automation, where we run with Verifier enabled.

Digging in

Filter Verifier’s complaint boils down to: you are calling FltAllocateGenericWorkItem but we can’t confirm if you are calling FltFreeGenericWorkItem.

We use generic work items sparingly in our code and I could see all three places were indeed calling FltFreeGenericWorkItem correctly.

I did try to blame our code, but to no avail — I got to the point where I could see us calling FltFreeGenericWorkItem and Filter Verifier somehow couldn’t tell that we had called it.

Oddly this was only happening with release builds; I couldn’t reproduce the “leak” with debug builds.

Really Digging in

Without any leads in our code, we turned to the Filter Verifier code. Stepping through was quite enlightening – it turns out that Filter Verifier walks the stack to try and map the caller to a Filter object (from Windows 11 22621):

So, What’s the Problem?

Compiler optimization is the problem! This is our function:

void MyClass::DoCallback(_In_ PFLT_GENERIC_WORKITEM pWorkItem, _In_ PVOID pFilter, _In_ PVOID pContext)
{
	// Do some stuff
	…
	FltFreeGenericWorkItem(pWorkItem);
}

In the unoptimized case, we see a normal call instruction followed by a stack cleanup / return.

In the optimized case, we see the crafty compiler has removed all trace of our function from the stack. It issues a jmp to FltFreeGenericWorkItem, which then returns execution to *our* caller.  I vaguely remember learning about this in school — tail call optimization.

The Fix

The fix is one line. Adding some code *after* the call to FltFreeGenericWorkItem fixed the problem. The cleanup / jmp pattern only happens because FltFreeGenericWorkItem is the last line of the function.

Addendum

  1. Stack walking really is dangerous! I never considered this case before, though I’ve worked on products that do walk the stack sometimes.
  2. Why so suspicious Filter Manager? The work item does contain a _FLT_OBJECT parameter – at the very least, if the stack check fails you could use that to find the correct filter.
  3. The code in question has changed recently, though I think the issue is still present in the old version. Here’s the listing from Windows 11 21H2 – the function calculates the caller’s address internally:
Posted in Debugging, Kernel, Windows | Leave a comment

Decoding Kernel ETLs More Easily!

I’ve been using WPP tracing in the kernel for many years. On the upside, WPP tracing uses a mechanism which is super fast and space efficient. On the downside, the output is in a binary format and it’s cumbersome to convert the file to human-readable text.

I seem to have missed the class where we learn that it’s not so cumbersome — In this article I will show how to decode ETL files with a right-click of the mouse.

ETL Basics

WPP tracing uses Event Tracing for Windows (ETW) under the hood; this mechanism is provided by the operating system and is used for OS debugging and performance tracing. The format is documented in various places, including MSDN.

ETW generates an ETL file that needs to be run through the Microsoft tracefmt.exe tool (or similar) before it can be read by humans.

An ETW record consists of a few pieces of information; for our purposes, we can think of a record as a printf statement, where the format string is represented by a GUID followed by a variable number of parameters.

typedef struct _EVENT_TRACE {
  EVENT_TRACE_HEADER Header;
...
  GUID               ParentGuid;   // printf format string
  PVOID              MofData;      // parameters
  ULONG              MofLength;
...
} EVENT_TRACE, *PEVENT_TRACE;

The sleight-of-hand is in taking the GUID and mapping it to a format string. This mapping information is stored in the private PDB symbols of the driver. It may also be stored as a set of .tmf (trace message format?) files that can be generated from the PDB using a tool like tracepdb.

A Cumbersome Approach

The main problem I’ve had in the past is figuring out the PDB that contains the necessary GUID -> string mapping. My understanding was that there was no knowledge of this in the ETL file so until now I’ve manually provided specific PDBs and tmf files to whatever decoding tool I was using (if you use tracefmt, you can specify these manually using the -pdb and -tmf flags, respectively.)

However, when recently playing with tracefmt and an ETL taken on a Windows 10 machine, I noticed that tracefmt automatically searched my symbol server for the correct PDB!

I’ve looked over the structures in the ETL file and I’m still not sure how it got this information. Please comment if you know where this mapping is kept. In any case, this makes life easier in a couple of ways:

  1. You don’t have to point tracefmt in the right direction. It can get the information directly from the ETL file.
  2. If you don’t have the correct PDB on your system, you can at least know the PDB name and hash that you need.

Making Life Easier

Note: We can make life easier for ETLs collected on Windows 10+. I tried this on ETLs collected on XP and Windows 7 and the PDB info was not available in either case. I haven’t investigated any other operating systems.

Here is my new workflow:

  1. Set up a local symbol server. This is not onerous – it’s a just a directory that contains symbol files. This great post by Bruce Dawson has lots of information about symbols, symbol servers, and making it all work.
  2. Set up the _NT_SYMBOL_PATH environment variable. See Bruce Dawson’s article above.
  3. Add symbols to your symbol store via the symstore tool that comes with Debugging Tools for Windows. See Bruce Dawson’s article above.
  4. Set up a shell extension for right-click decoding of ETL files. This is as easy as adding a couple of registry entries. See below for an example
  5. Have Procmon running just in case, to catch the PDB hashes of any symbol files that I’m missing. Then I can search my companies central symbol repository for anything I’m missing, without having to download hundreds of PDBs onto my system.
Windows Registry Editor Version 5.00

[HKEY_CLASSES_ROOT\SystemFileAssociations\.etl\shell\decode]
@="Decode ETL..."

[HKEY_CLASSES_ROOT\SystemFileAssociations\.etl\shell\decode\command]
@="C:\\t2\\etls\\tracefmt.exe \"%1\" -o \"%1.log\" -cp utf8"
Posted in Debugging, TipsAndTricks, Windows | Tagged , | 2 Comments

File ID Cheat Sheet

The Problem With Filenames (Summary)

In recent years, identifying a file by a filename has become less and less attractive. Here’s an incomplete list of problems.

ProblemComments
Per-folder case sensitivityNew in Windows 10 1803/RS4, on NTFS and NTFS accessed over SMB, whereby the content of a folder can only be accessed by case-sensitive names.

Update: Later versions of Windows dis-allow you to access case-sensitive folders across the network because srv is not case aware and it can serve the wrong file.
HardlinksLong-standing feature of NTFS, where a file can have multiple names. In particular, a file can be modified via multiple paths.
Volume mount points / junctionsLong-standing feature of NTFS and REFS, where a volume can be mounted to a folder via the use of a junction reparse point.

Junctions can point to any local directory on a system. There are very interesting attacks based on the fact that creating a junction does not require Admin access.

RPC Control Attack
Deleting System Files
SymlinksLong-standing feature of NTFS and REFS, where a file can point to any other file or directory via the use of a symlink reparse point. More flexible than junctions, but require Admin access to set up.
Windows ContainersThis is the technology used by Docker under the covers. The kernel is shared with these containers and so c:\… inside the container is completely different than c:\… outside the container. There are other issues as well. I’ll discuss in a future post.

File ID Support by FS

Instead of relying (solely) on the filename, you may also want to keep the volume GUID and file ID around to prevent malicious and non-malicious confusion. Some file systems have a nice feature where you can even open a file by its ID to save trips to the kernel.

File SystemRemains the same ID for 
the lifetime of the file?
Size of file IDSupports open by file ID
NTFSYes64-bit, 128-bit on Win 8.1+1Yes
REFSYes128-bit, with 64-bit compatibility1Yes
FATNo (dynamically generated based on the first cluster of the file -the ID changes if you rename the file).n/aNo
FAT32No (same comments as FAT)n/aNo
exFATNo (same comments as FAT)n/aNo
SMBDepends on the underlying FSDepends on the underlying FSNo
UDFYes64-bitYes

FAQ

Can I delete a file by ID?

No. Deleting a file involves opening it, marking it for deletion, and then closing the handle. Unfortunately, you can’t mark a file for deletion if you open it by ID. This makes sense, at least on NTFS, since a file can have multiple names (hardlinks). If you open it by ID, the FS doesn’t know which link to remove.

However, you can still open the file by path and compare it to the expected ID. If it doesn’t match, don’t delete the file.

Note that if a file has multiple hardlinks, deleting one of them will not fully delete the file. To remedy this you can use the FindFirstFileNameW API in user mode to query all the links. If you’re in kernel, you can use ZwQueryInformationFile with the FileHardLinkInformation info class, which adds some complexity. Again, since you are trying to delete by ID you should compare the ID before deleting each link.

Can I open a file once its marked for deletion?

Sometimes. If a file is opened via multiple handles and one of them marks the file for deletion, the file historically stays in the namespace (i.e. visible) until the last handle is closed. Even though it’s in the namespace, if you try and open it again, you get an error (STATUS_DELETE_PENDING / ERROR_ACCESS_DENIED).

In Windows 10 RS1+, there is a new way to delete a file that allows you to remove the file from the namespace even if there are open handles. Update: Starting around Windows 10 1903/19H1, DeleteFile uses this new method to delete files, and remove them from the namespace right away.

How about a handy chart?

Deletion typeWill the file remain in the FS namespace until last handle it closed?Can I open a new handle to the file?
FileDispositionInformationYes.No, not even by ID.
FileDispositionInformationExNo, if you pass the FILE_DISPOSITION_POSIX_SEMANTICS flag.Yes, by ID. (tested on NTFS)

If I have a file ID and volume GUID, can I get a filename for it?

  1. Yes. Here’s one way that uses file info classes on an open handle:
    1. Query the filename via the FileNameInformation info class. It will return you a  name for the file, since on NTFS, a file can have multiple names (hardlinks). Note that this only gives you the path starting with the root directory (ex: \foo\bar.txt).
    2. You can then query the volume via the FileVolumeNameInformationClass.
  2. You can also use win32 APIs to get a name for the file:
    1. Use CreateFIle to open something (the root directory seems to work well) on the volume..
    2. Use OpenFileByID to open the file by ID. You need to pass in the HANDLE from the previous step.
    3. Use GetFinalPathByHandle to get a name for the file.

Posted in Cheatsheet, File System, Windows | 2 Comments