- From the project editor, click on the Add text button on the left-side toolbar.
- Choose a text element, then drag and drop it onto the canvas.
These are the available text element options:
- Title: Used as a primary heading to name the project.
- Subtitle: Used as a secondary heading to name sub-sections in your project.
- Body text: Usually the most-read text element on the page. Make sure to derive other text element sizes from the body text size.
- Caption text: Highlights the essence of a chart or map. Captions can be written in just a few words or a few sentences. Keep it short to make it most effective.
- Quote: A reproduction of what another person said or wrote. For example, use quotes to convey customer reviews.
- Facts & figures and Centered fact and figure: Both elements are text-based charts with icons. Best used to highlight interesting facts.
- Table chart: A great option for displaying data with both textual and numeric columns. Read more about it here.
Check out our other articles to see how to edit and resize text objects, as well as add graphic elements that contain text."}},{"@type":"Question","name":"How do I undo/redo an action?","acceptedAnswer":{"@type":"Answer","text":"
To undo or redo any edits in your project, simply use the arrow buttons in the toolbar just above your project. The left arrow allows you to undo and revert to a previous version of your project. The right arrow allows you to redo any edits. You can click the arrows several times to go back to where you started or to where you finished.\n\nYou can also use keyboard controls ⌘ + Z (on Mac) or Ctrl + Z (on Windows) to undo.\n\n
Note: Remember that after exiting or closing the project editor, the action history will be lost (unless you have a business, team, or enterprise account)\n\nIf you have started your project by clicking on the Responsive web and mobile layouts shortcut, after you delete a chart, map, text field, or any other object from your report, a message will appear in its place allowing you to undo the last action. No other action history is available when working with Responsive web and mobile layouts!"}},{"@type":"Question","name":"Where to use interactive word clouds?","acceptedAnswer":{"@type":"Answer","text":"
Word clouds are used to get immediate insights into the most important words or terms in your data. You’ll often find them on websites or blogs flagging top keywords or tag usage for aesthetic reasons. For example, tag clouds can help you visualize how customers feel about your products.
Another great use for a word cloud is to summarize user surveys for a client. If consumers are given a list of words to describe their feelings towards a service or product, a word cloud can quickly summarize those responses, ranking the most selected words with the largest text. This data can easily start a conversation with your client or user’s impressions of their brand or product.
When sharing results from a lot of technical data, word clouds help viewers understand the results quickly even if they don’t have a mastery of the data.
Be aware that counting results isn’t always comparing results. Avoid including words like “the”, “and”, and “but” in word clouds as they don’t offer any insight into data. Also, be careful not to use too much color or too many fonts. The simpler the design, the easier it is to deliver an effective and engaging message."}},{"@type":"Question","name":"How to create a word cloud?","acceptedAnswer":{"@type":"Answer","text":"
You can create a word cloud in 5 easy steps:
- Join Infogram to make your own tag cloud design.
- Select a word cloud chart type.
- Upload or paste your data.
- Customize colors, fonts, and text orientation.
- Download your Word cloud or embed it on your website.
"}},{"@type":"Question","name":"What are some best practices for creating word clouds?","acceptedAnswer":{"@type":"Answer","text":"
Even though they are simple and easy to understand, you should keep a few things in mind when using word clouds:
- Long words are emphasized over short words.
- Tags in the middle of the cloud attract more user attention than tags near the borders.
- Avoid using too many words. Word clouds can take up a lot of space.
https://www.youtube.com/watch?v=dnqEQVI5e9A&feature=youtu.be"}},{"@type":"Question","name":"What is a word cloud, and why should I use one?","acceptedAnswer":{"@type":"Answer","text":"
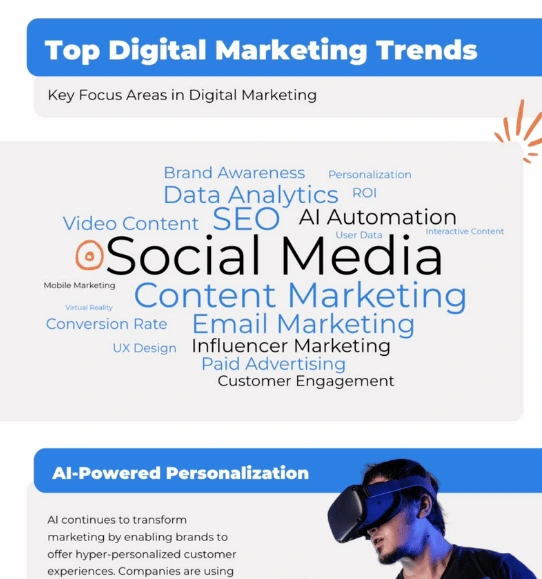
A word cloud is a visual representation of text data, where the size of each word indicates its frequency or importance. You can use word clouds to quickly convey key themes or ideas from your data, making it easier for your audience to grasp the main points without diving into the details."}},{"@type":"Question","name":"Where can I use word clouds effectively?","acceptedAnswer":{"@type":"Answer","text":"
Word clouds are great for various settings, such as:
- Marketing: Visualizing customer feedback or sentiment about a product.
- Education: Summarizing student survey results or key topics from a lesson.
- Journalism: Highlighting important themes from interviews or articles.
- Consulting: Presenting insights from client feedback or industry trends.
"}},{"@type":"Question","name":"How do I create a word cloud in Infogram?","acceptedAnswer":{"@type":"Answer","text":"
Creating a word cloud is simple! Follow these steps:
- Sign up or log in to Infogram.
- Choose the word cloud chart type.
- Upload or paste your text data.
- Customize the design with colors and fonts.
- Download your word cloud or embed it in your website.
"}},{"@type":"Question","name":"What are some best practices for designing word clouds?","acceptedAnswer":{"@type":"Answer","text":"
Here are some tips to enhance your word cloud:
- Focus on keywords: Use impactful words that convey your message.
- Limit the word count: Too many words can clutter the design. Aim for clarity.
- Consider word placement: Words in the center attract more attention, so place your key terms there.
- Simplify the design: Use a few colors and fonts to keep it clean and readable.
"}},{"@type":"Question","name":"What common mistakes should I avoid when creating a word cloud?","acceptedAnswer":{"@type":"Answer","text":"
- Including stop words: Avoid using common words like "the," "and," or "but" as they don’t add value.
- Overcomplicating the design: Too many colors or fonts can confuse your audience. Stick to a simple style.
- Using long words: Longer words may overshadow important shorter ones, so balance your choices.
"}},{"@type":"Question","name":"How can I share my word cloud once it's created?","acceptedAnswer":{"@type":"Answer","text":"
Once you've designed your word cloud in Infogram, you can easily share it by:
- Downloading the image: Save it as a PNG or JPEG to use in presentations or reports.
- Embedding it: Use the embed code provided by Infogram to display your word cloud on your website or blog.
"}},{"@type":"Question","name":"Can I customize the appearance of my word cloud?","acceptedAnswer":{"@type":"Answer","text":"
Yes! Infogram allows you to customize your word cloud’s colors, fonts, and orientation. Choose styles that align with your brand or the message you want to convey. Just keep readability in mind!"}},{"@type":"Question","name":"How can I add additional text or context to my word cloud?","acceptedAnswer":{"@type":"Answer","text":"
To enhance your word cloud:
- In the project editor, click on the “Add text” button on the left toolbar.
- Select a text element (title, subtitle, body text, etc.) and drag it to your canvas.
- Use these elements to provide context or explanations that complement your word cloud.
"}},{"@type":"Question","name":"Are there any resources to help me improve my word cloud skills?","acceptedAnswer":{"@type":"Answer","text":"
Absolutely! Infogram offers tutorials and guides to help you get the most out of your word clouds. Additionally, exploring examples of effective word clouds can inspire your designs."}},{"@type":"Question","name":"How do I ensure my audience understands my word cloud?","acceptedAnswer":{"@type":"Answer","text":"
To make your word cloud effective, consider your audience's familiarity with the topic. Use clear labels, provide context, and keep your design simple. You might also want to include a brief explanation of what the word cloud represents and how to interpret it."}}]}
Create Interactive Word Cloud in Minutes
Transform text into engaging visual stories with Infogram's word cloud maker.


4.7 out of 5 stars


Overview
Why
Examples
Reviews
Tips
FAQ
Highlight the Most Significant Words and Themes
Creating effective reports, dashboards, and infographics often comes with challenges. We frequently struggle to convey complex information clearly and engagingly, which can hinder communication and affect decision-making. This is where word clouds become useful, as they simplify data visualization. By converting text into a visually appealing format, word clouds highlight the most significant words and themes, making it easier to identify key insights at a glance.
Word clouds are valuable because they provide a visual summary of data, allowing you to quickly spot patterns and trends in their content. Whether you are a content writer focusing your narrative, a journalist analyzing public sentiment, or a marketer aiming to capture audience attention, word clouds can enhance your storytelling and data presentation. They are beneficial for a wide range of professionals, including analysts, consultants, teachers, and students, enabling them to present information effectively in their respective fields.
What makes Infogram's word cloud feature unique is its user-friendly interface and customizable options, allowing you to create visually appealing representations tailored to your needs. This ease of use, along with the ability to integrate word clouds seamlessly into larger projects, makes it a top choice among similar tools.
If you're looking to improve your data visualization skills and create more impactful reports, explore how word clouds can transform your projects in Infogram. Discover the potential today and see the difference it can make in your work!
Explore Why Word Cloud Are Useful
Find out why word clouds are great to use for your data visualization process.

Use Text Analysis
Word clouds are an excellent tool for performing text analysis, especially when dealing with large volumes of data. By generating a word cloud in Infogram, you can visually highlight the most frequently used words in a dataset, making it easy to spot recurring themes, topics, or patterns. This allows you to quickly identify important insights or areas that may require further investigation.
Whether you're analyzing customer feedback, survey results, or research documents, word clouds offer a simple and effective way to distill key information. If you're wondering how to create a word cloud, the process is intuitive, and the resulting visual can be a powerful asset for decision-making, content curation, or identifying priority areas in your analysis.

Improve Communication and Presentation
Word clouds are a valuable tool for enhancing communication in presentations, reports, and other forms of content. They can take complex or lengthy text-based information and turn it into a visually engaging format, making it easier for your audience to understand. By displaying the most important words or themes prominently, word clouds help convey key messages quickly and effectively.
They are particularly useful when you want to emphasize recurring ideas or highlight main topics without overwhelming your audience with text. The process of creating a word cloud is simple and adds a dynamic visual element to your content, making your presentations or reports more engaging and accessible.

Content Summarization
Word clouds are ideal for summarizing large amounts of text, allowing you to quickly get a sense of the most important topics within a document. Instead of reading through lengthy articles, reports, or transcripts, you can use a word cloud to highlight the most frequent or relevant words, providing a clear snapshot of the document’s key points.
This not only saves time but also offers a visual preview that helps readers understand the main themes at a glance. Learning how to create a word cloud is easy, and once you master it, you can use word clouds to efficiently summarize and communicate essential information, making it a handy tool for research, content review, and presentations.

Social Media Monitoring
Word clouds are highly effective for monitoring social media activity, such as analyzing comments, hashtags, or mentions. By generating a word cloud from social media data, you can quickly identify popular topics, trending keywords, or recurring sentiments. This can be particularly useful for tracking public opinion, understanding customer feedback, or assessing brand perception in real-time.
Word clouds give you a quick overview of what’s being discussed online, helping you adjust marketing strategies, improve engagement, or respond to emerging trends. The process of creating a word cloud is straightforward, and its application in social media monitoring can provide valuable insights for your business or marketing efforts.
Get Inspired by Infogram User-Created Projects
Visit example page
Marvels Movies Binge-Watch the Right Way

10 Years After the Deepwater Horizon Oil Spill

A Different Kind of March Madness

A Royal Wedding
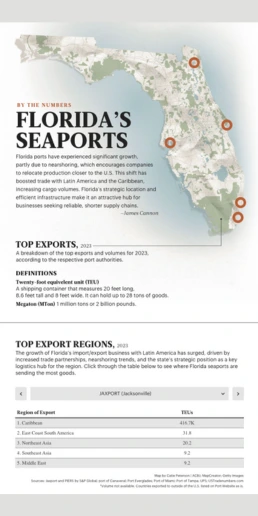
Florida Seaports

Category Evolution

Missions to the Moon

Norway's PM POP Poll: Solberg vs. Støre Interactive Chart
Customer Reviews
Here is what our customers have to say about us.
2022 Summer & Fall and 2023 Winter leader in Data Visualisation Software 4.7 out of 5 stars
See reviews on G2 ›Empowering 30,000+ Companies Worldwide
From startups to established enterprises, our platform has been embraced by a diverse range of businesses seeking to captivate audiences and simplify complex data. Here are just a few examples of the 30,000+ companies that use Infogram.


Learn More Practical Tips
Design
Data visualization trends you should look out for in 2023
Marketing
3 Unique Ways to Optimize Your Landing Pages with Charts
Data
How to choose the right chart for your data?
Data
The complete guide to different types of charts
Media
From data to story: Data journalism definition & examples
Data
AI for charts: Get AI-powered suggestions for the best chart type
Frequently Asked Questions
How does Infogram make interactive maps easy to create?
Infogram’s 800+ maps and simple tools let you build dynamic maps quickly. A data journalist can create a clickable election map, while a market researcher can plot customer locations, all without design skills. Import data from spreadsheets or PDFs, and add features like tooltips or animations. It’s fast, intuitive, and needs no coding.
How do I add text?
Give your projects a sense of structure by using text elements with predefined styles and a typographic hierarchy. This will allow your audience to navigate and understand your ideas more effectively.
To add text:
- From the project editor, click on the Add text button on the left-side toolbar.
- Choose a text element, then drag and drop it onto the canvas.
These are the available text element options:
- Title: Used as a primary heading to name the project.
- Subtitle: Used as a secondary heading to name sub-sections in your project.
- Body text: Usually the most-read text element on the page. Make sure to derive other text element sizes from the body text size.
- Caption text: Highlights the essence of a chart or map. Captions can be written in just a few words or a few sentences. Keep it short to make it most effective.
- Quote: A reproduction of what another person said or wrote. For example, use quotes to convey customer reviews.
- Facts & figures and Centered fact and figure: Both elements are text-based charts with icons. Best used to highlight interesting facts.
- Table chart: A great option for displaying data with both textual and numeric columns. Read more about it here.
Check out our other articles to see how to edit and resize text objects, as well as add graphic elements that contain text.
How do I undo/redo an action?
To undo or redo any edits in your project, simply use the arrow buttons in the toolbar just above your project. The left arrow allows you to undo and revert to a previous version of your project. The right arrow allows you to redo any edits. You can click the arrows several times to go back to where you started or to where you finished. You can also use keyboard controls ⌘ + Z (on Mac) or Ctrl + Z (on Windows) to undo.
Note: Remember that after exiting or closing the project editor, the action history will be lost (unless you have a business, team, or enterprise account) If you have started your project by clicking on the Responsive web and mobile layouts shortcut, after you delete a chart, map, text field, or any other object from your report, a message will appear in its place allowing you to undo the last action. No other action history is available when working with Responsive web and mobile layouts!
Where to use interactive word clouds?
Word clouds are used to get immediate insights into the most important words or terms in your data. You’ll often find them on websites or blogs flagging top keywords or tag usage for aesthetic reasons. For example, tag clouds can help you visualize how customers feel about your products.
Another great use for a word cloud is to summarize user surveys for a client. If consumers are given a list of words to describe their feelings towards a service or product, a word cloud can quickly summarize those responses, ranking the most selected words with the largest text. This data can easily start a conversation with your client or user’s impressions of their brand or product.
When sharing results from a lot of technical data, word clouds help viewers understand the results quickly even if they don’t have a mastery of the data.
Be aware that counting results isn’t always comparing results. Avoid including words like “the”, “and”, and “but” in word clouds as they don’t offer any insight into data. Also, be careful not to use too much color or too many fonts. The simpler the design, the easier it is to deliver an effective and engaging message.
How to create a word cloud?
You can create a word cloud in 5 easy steps:
- Join Infogram to make your own tag cloud design.
- Select a word cloud chart type.
- Upload or paste your data.
- Customize colors, fonts, and text orientation.
- Download your Word cloud or embed it on your website.
What are some best practices for creating word clouds?
Even though they are simple and easy to understand, you should keep a few things in mind when using word clouds:
- Long words are emphasized over short words.
- Tags in the middle of the cloud attract more user attention than tags near the borders.
- Avoid using too many words. Word clouds can take up a lot of space.
https://www.youtube.com/watch?v=dnqEQVI5e9A&feature=youtu.be
What is a word cloud, and why should I use one?
A word cloud is a visual representation of text data, where the size of each word indicates its frequency or importance. You can use word clouds to quickly convey key themes or ideas from your data, making it easier for your audience to grasp the main points without diving into the details.
Where can I use word clouds effectively?
Word clouds are great for various settings, such as:
- Marketing: Visualizing customer feedback or sentiment about a product.
- Education: Summarizing student survey results or key topics from a lesson.
- Journalism: Highlighting important themes from interviews or articles.
- Consulting: Presenting insights from client feedback or industry trends.
How do I create a word cloud in Infogram?
Creating a word cloud is simple! Follow these steps:
- Sign up or log in to Infogram.
- Choose the word cloud chart type.
- Upload or paste your text data.
- Customize the design with colors and fonts.
- Download your word cloud or embed it in your website.
What are some best practices for designing word clouds?
Here are some tips to enhance your word cloud:
- Focus on keywords: Use impactful words that convey your message.
- Limit the word count: Too many words can clutter the design. Aim for clarity.
- Consider word placement: Words in the center attract more attention, so place your key terms there.
- Simplify the design: Use a few colors and fonts to keep it clean and readable.
What common mistakes should I avoid when creating a word cloud?
- Including stop words: Avoid using common words like "the," "and," or "but" as they don’t add value.
- Overcomplicating the design: Too many colors or fonts can confuse your audience. Stick to a simple style.
- Using long words: Longer words may overshadow important shorter ones, so balance your choices.
How can I share my word cloud once it's created?
Once you've designed your word cloud in Infogram, you can easily share it by:
- Downloading the image: Save it as a PNG or JPEG to use in presentations or reports.
- Embedding it: Use the embed code provided by Infogram to display your word cloud on your website or blog.
Can I customize the appearance of my word cloud?
Yes! Infogram allows you to customize your word cloud’s colors, fonts, and orientation. Choose styles that align with your brand or the message you want to convey. Just keep readability in mind!
How can I add additional text or context to my word cloud?
To enhance your word cloud:
- In the project editor, click on the “Add text” button on the left toolbar.
- Select a text element (title, subtitle, body text, etc.) and drag it to your canvas.
- Use these elements to provide context or explanations that complement your word cloud.
Are there any resources to help me improve my word cloud skills?
Absolutely! Infogram offers tutorials and guides to help you get the most out of your word clouds. Additionally, exploring examples of effective word clouds can inspire your designs.
How do I ensure my audience understands my word cloud?
To make your word cloud effective, consider your audience's familiarity with the topic. Use clear labels, provide context, and keep your design simple. You might also want to include a brief explanation of what the word cloud represents and how to interpret it.
Didn't find the answer? Check our FAQs

Try Infogram Now
Are you ready to unleash the power of data visualization? Get started with Infogram today and create stunning, interactive content that captivates your audience. Elevate your projects and bring data to life.
- Embedding it: Use the embed code provided by Infogram to display your word cloud on your website or blog.
- Overcomplicating the design: Too many colors or fonts can confuse your audience. Stick to a simple style.
- Limit the word count: Too many words can clutter the design. Aim for clarity.
- Sign up or log in to Infogram.
- Subtitle: Used as a secondary heading to name sub-sections in your project.
- Choose a text element, then drag and drop it onto the canvas.
