Complexity and learning curve analyses are some of the most important tasks in a Machine Learning project.
Learning curve: Graphs that compares the performance of a model on training and testing data over a varying number of training instances.
We should generally see performance improve as the number of training points increases.
Complexity curve: Graphs that show the model performance over training and validation set for varying degree of model complexity (e.g. degree of polynomial for linear regression, number of layers or neurons for neural networks, number of estimator trees for a Boosting algorithm or Random Forest)
Complexity curve allows us to verify when a model has learned as much as it can about the data without fitting to the noise. The optimum learning (given the fixed data) occurs when,
- The performances on the training and testing sets reach a plateau
- There is a consistent gap between the two error rates
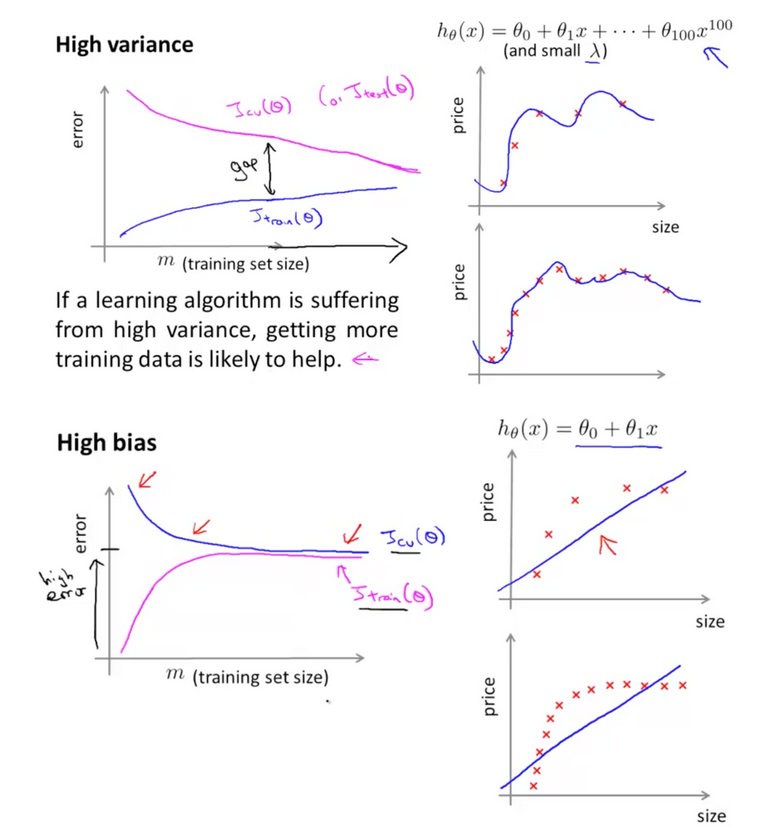
The key is to find the sweet spot that minimizes bias and variance by finding the right level of model complexity. Of course with more data any model can improve, and different models may be optimal.
Following is the intuitive illustration of model complexity curve from Andrew Ng's Machine Learning course